M82 Chandra → SQUDE Mock Spectrum
Physical Chandra fit → a SQUDE mock from the same source model → a Chandra-RMF resolution control at fixed SQUDE ARF.
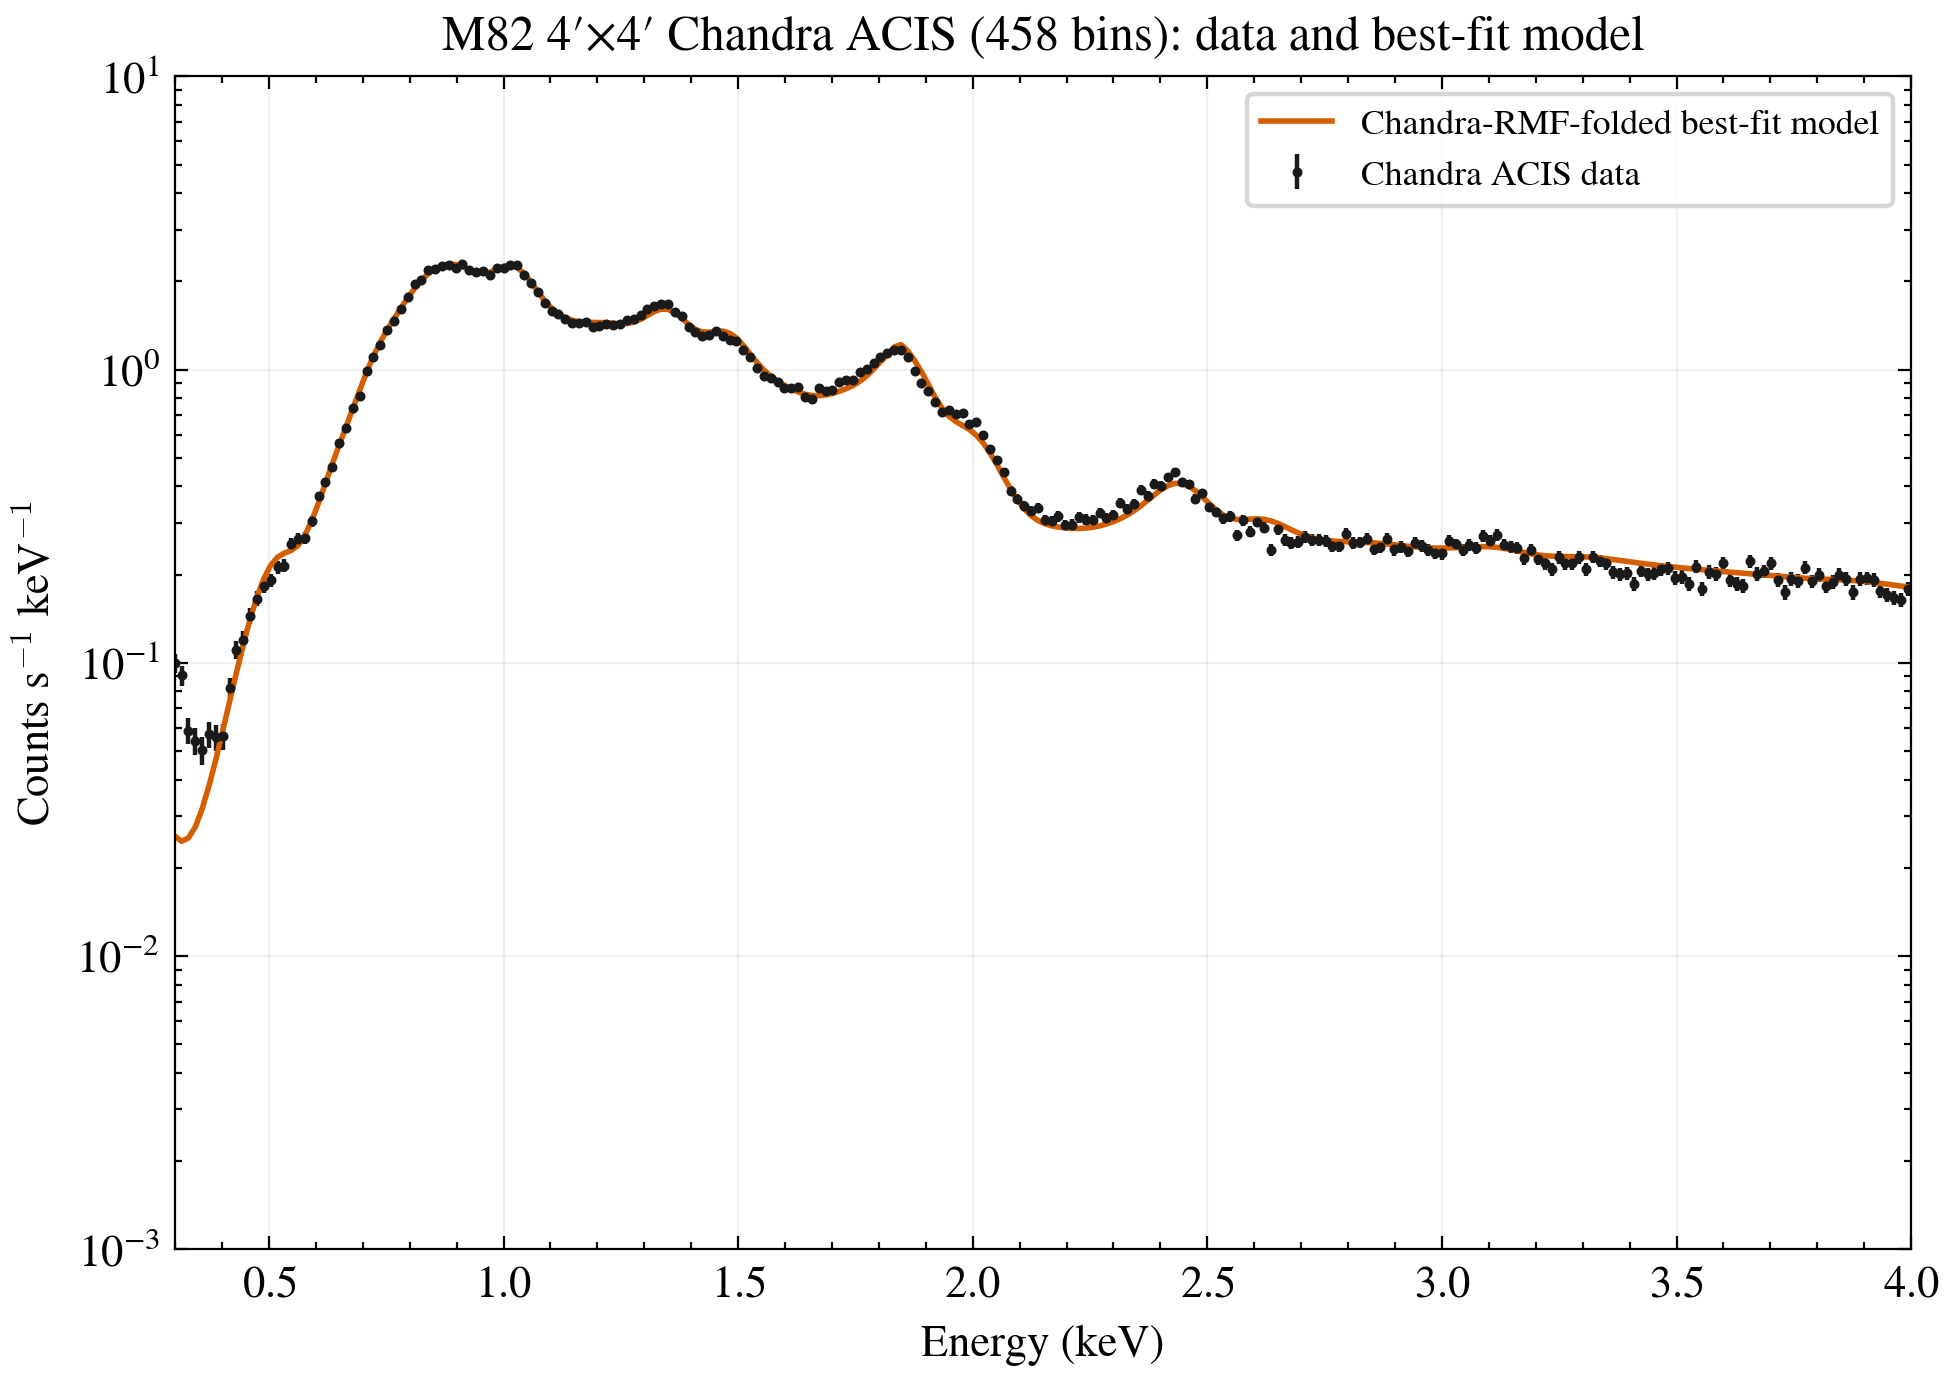
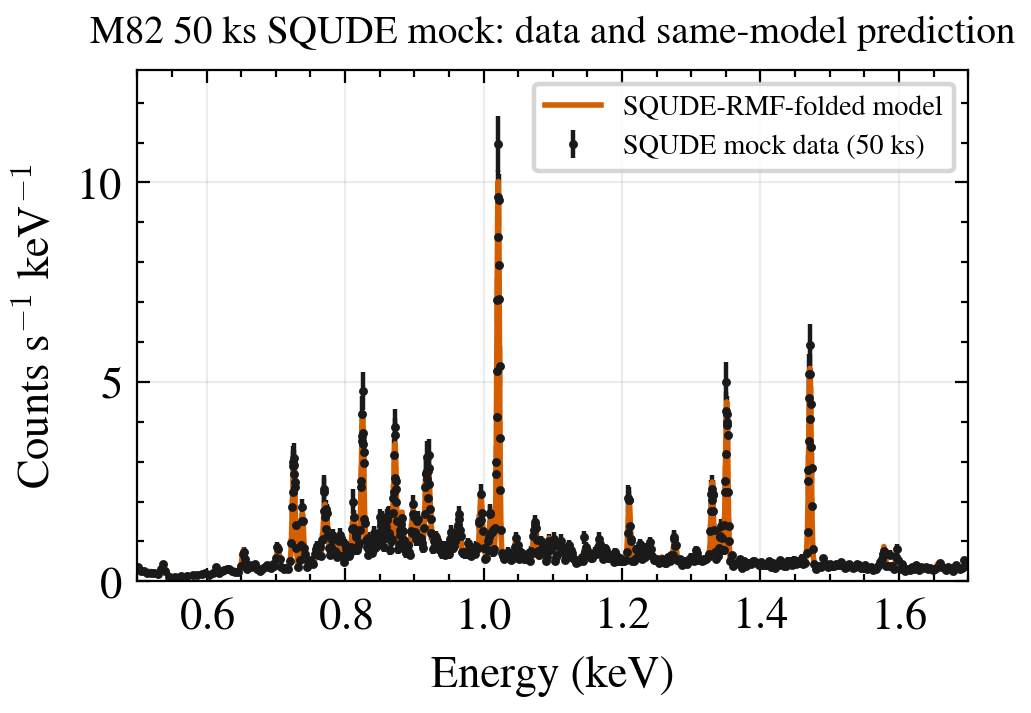
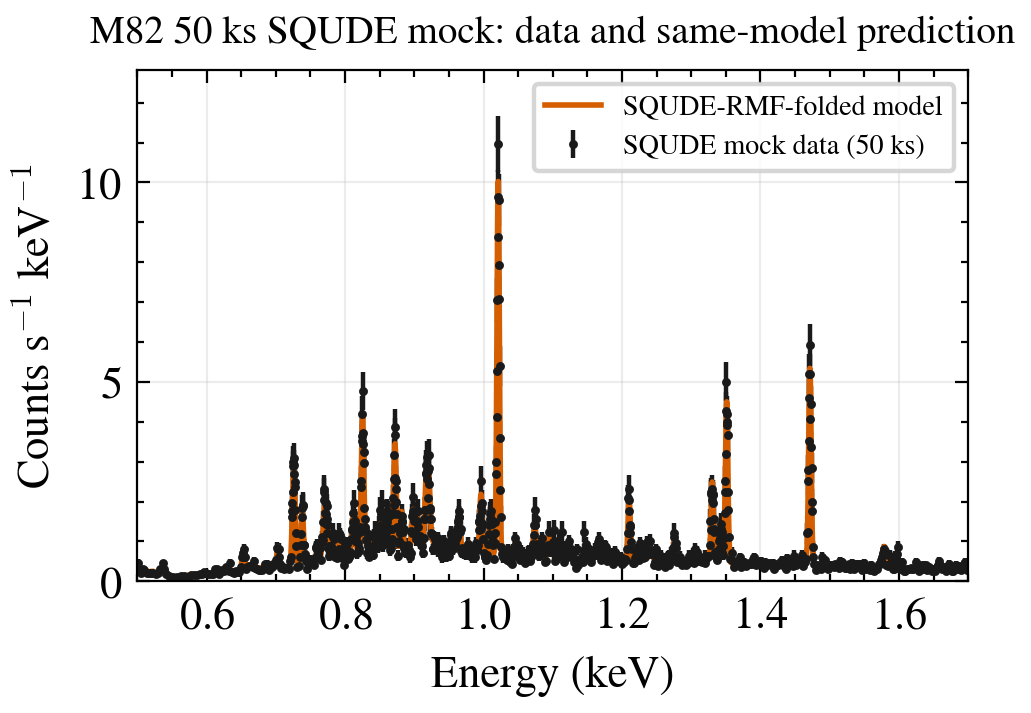
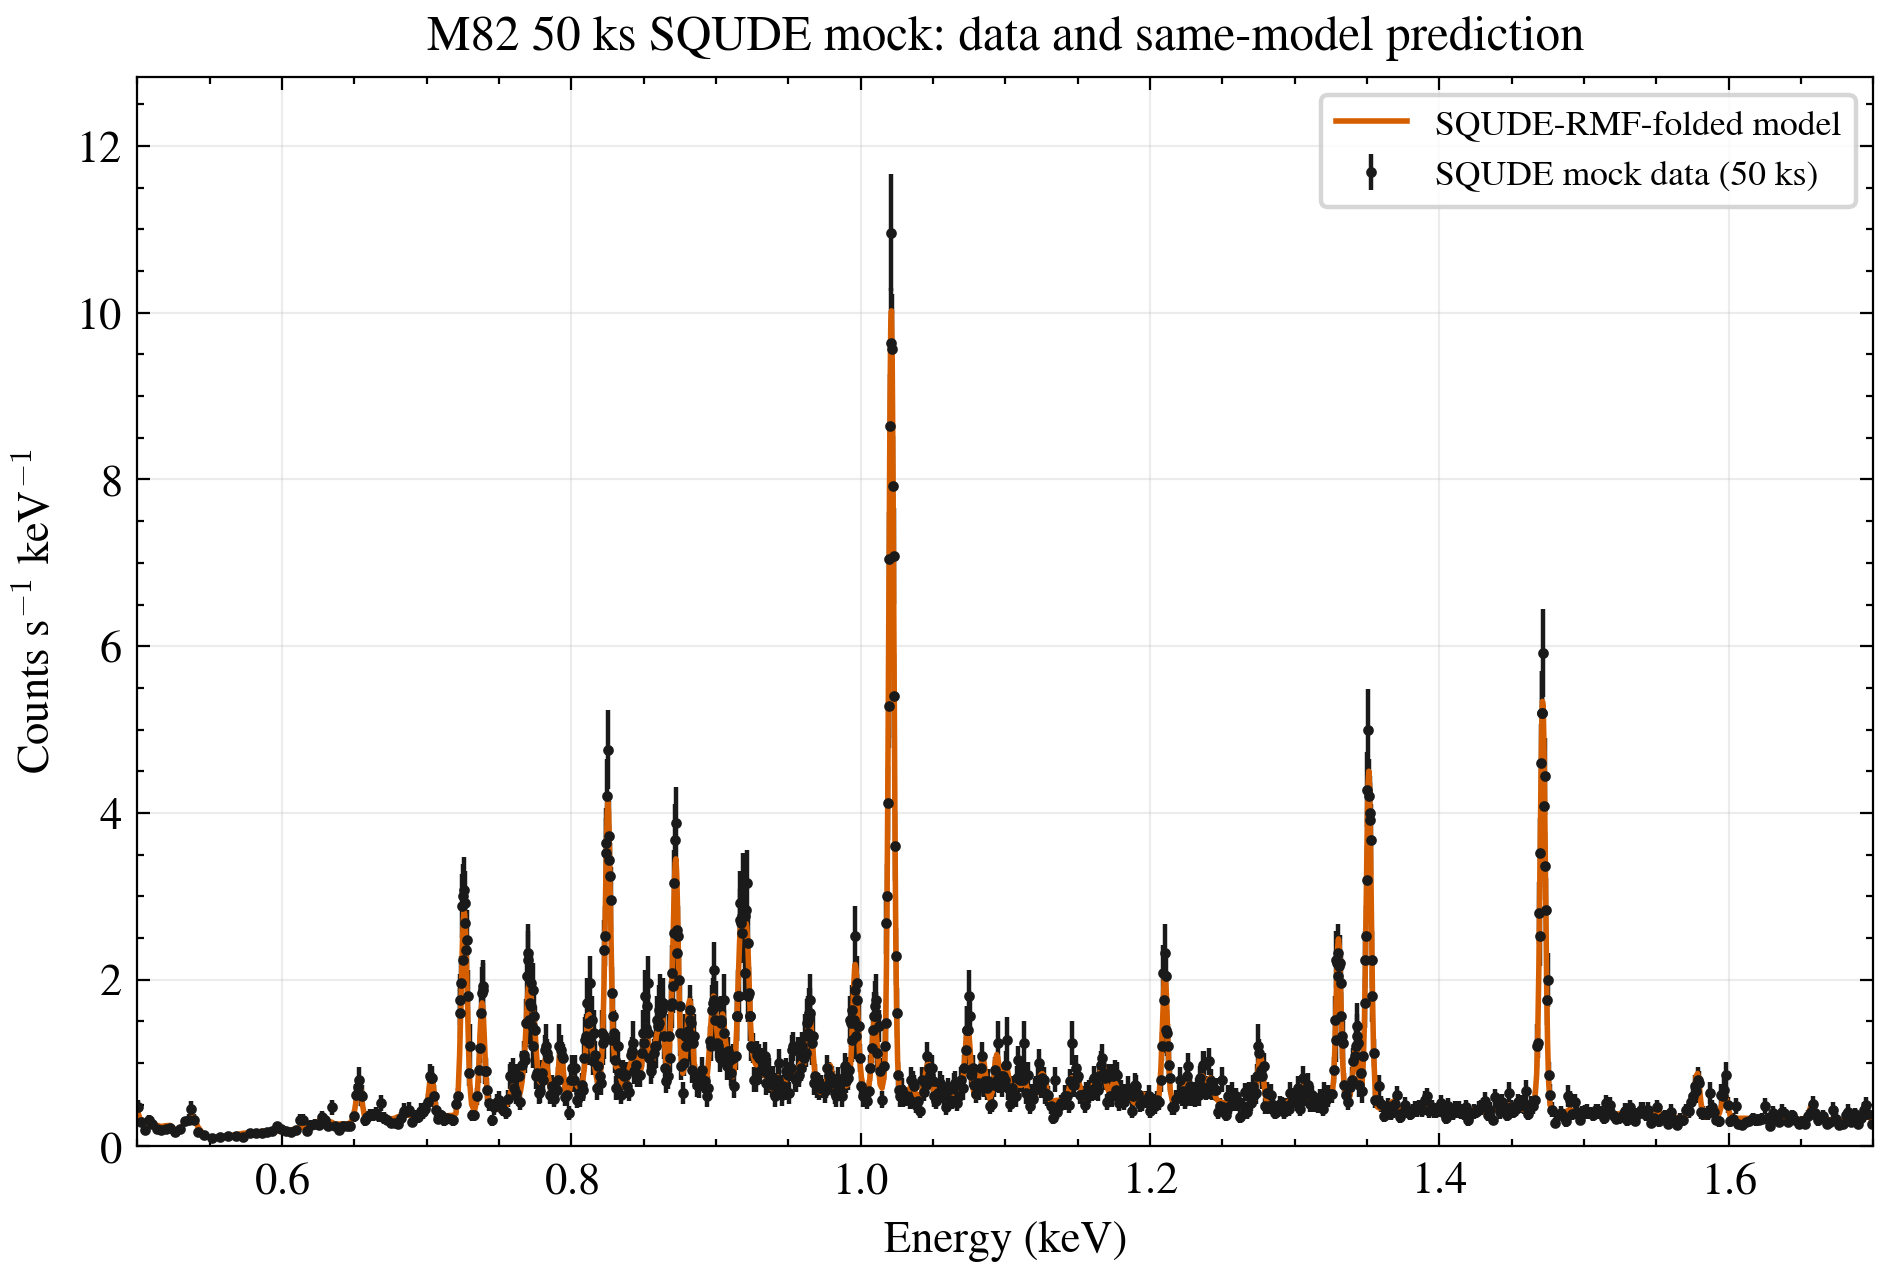
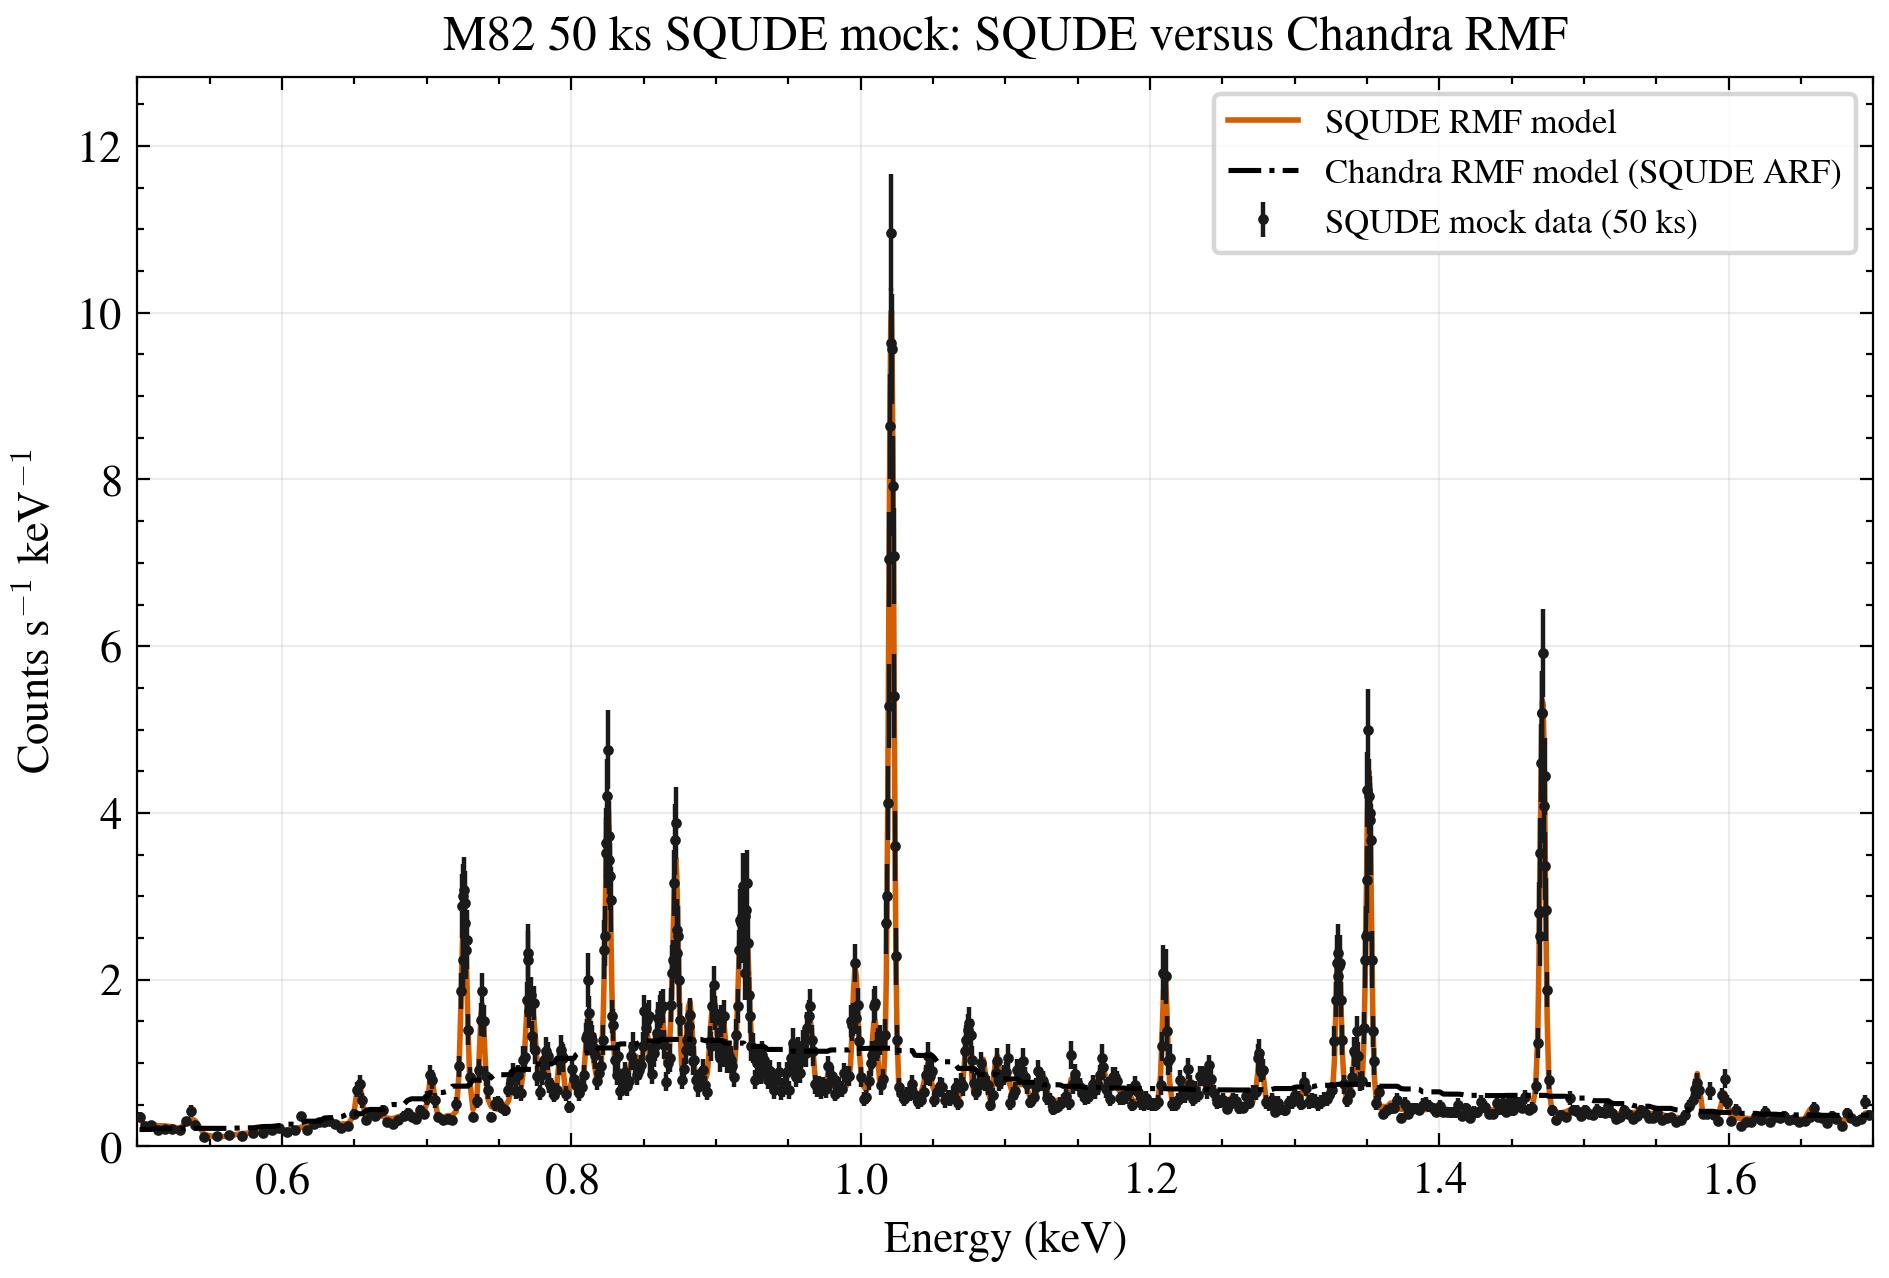
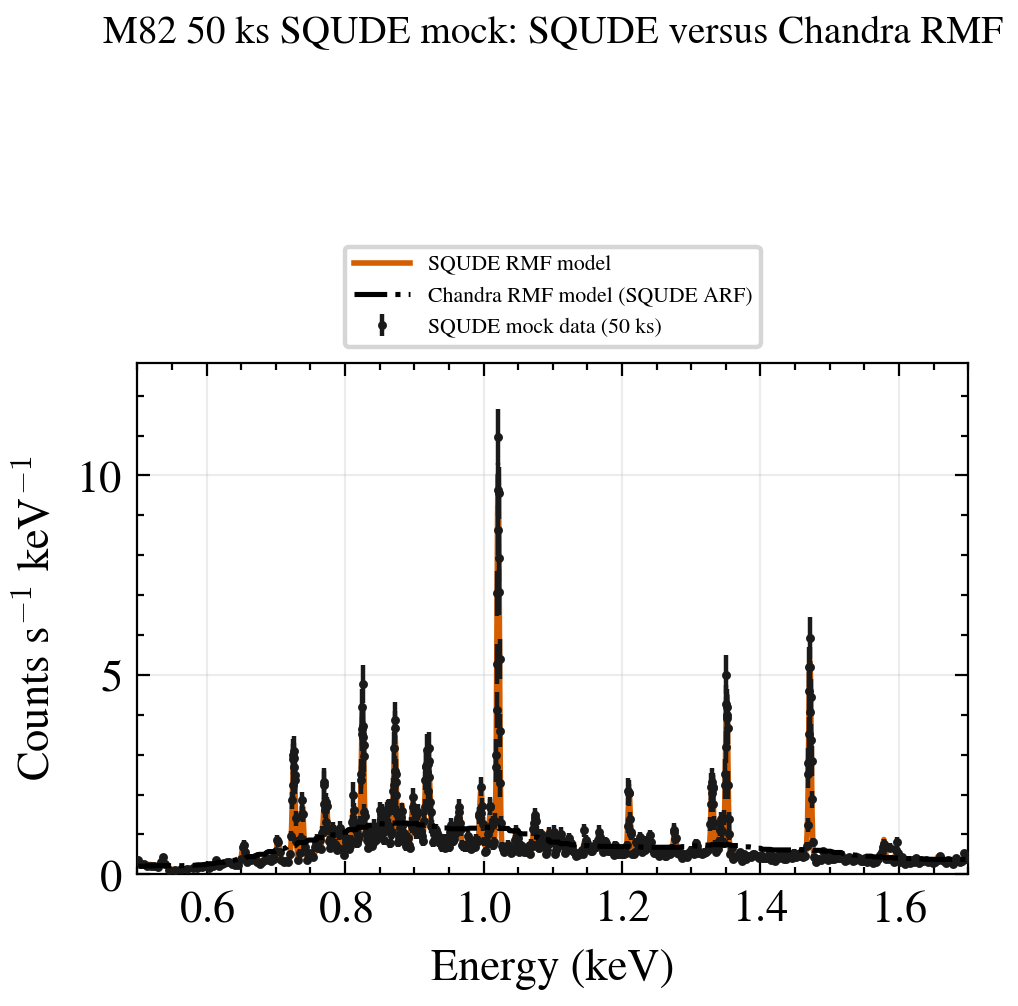
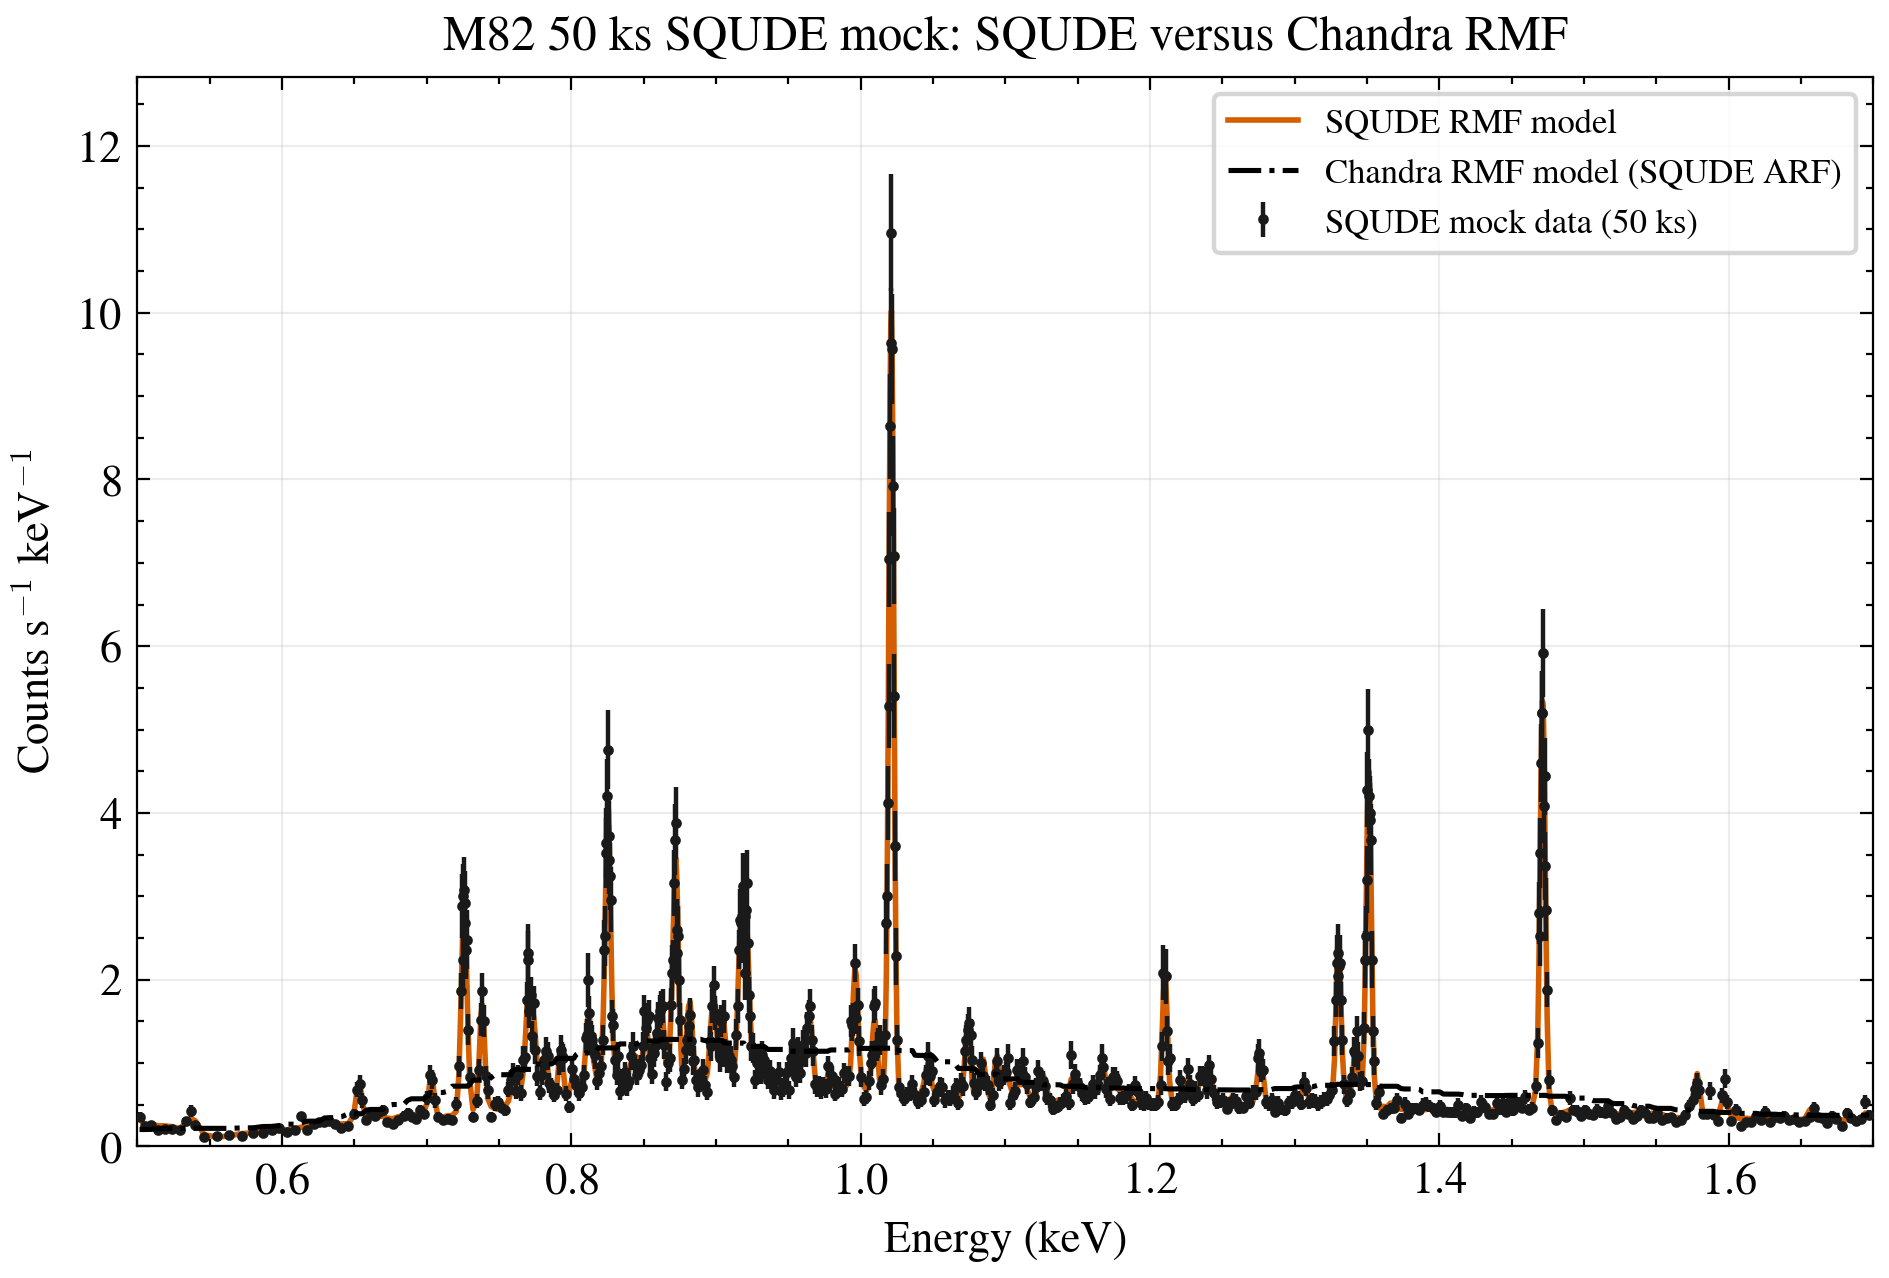
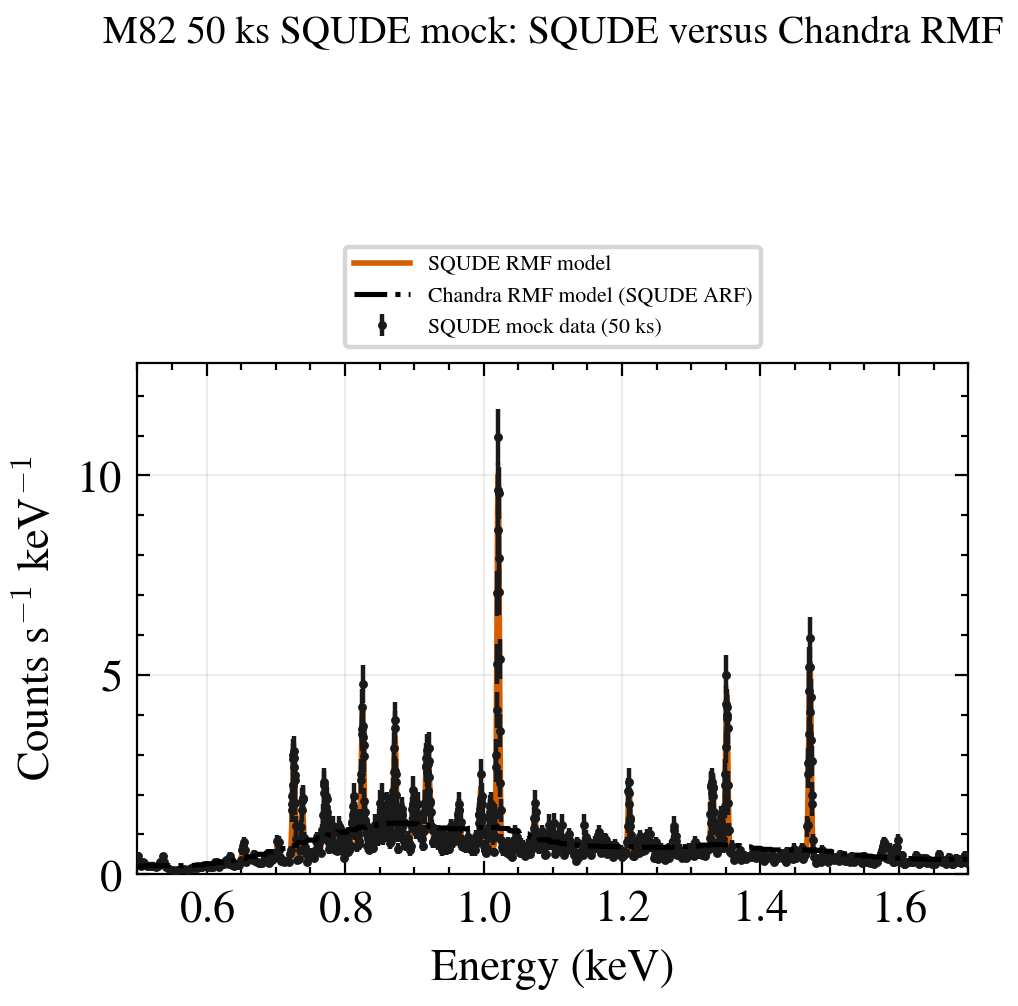
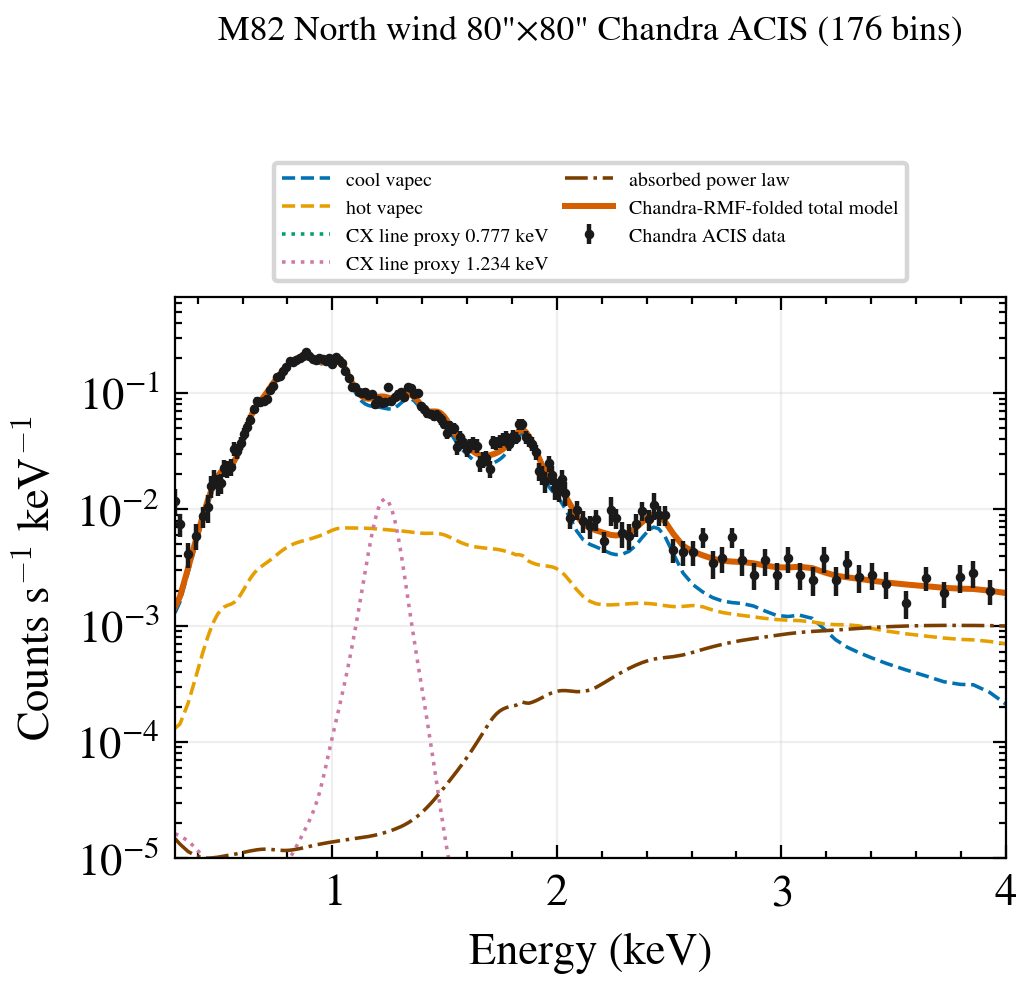
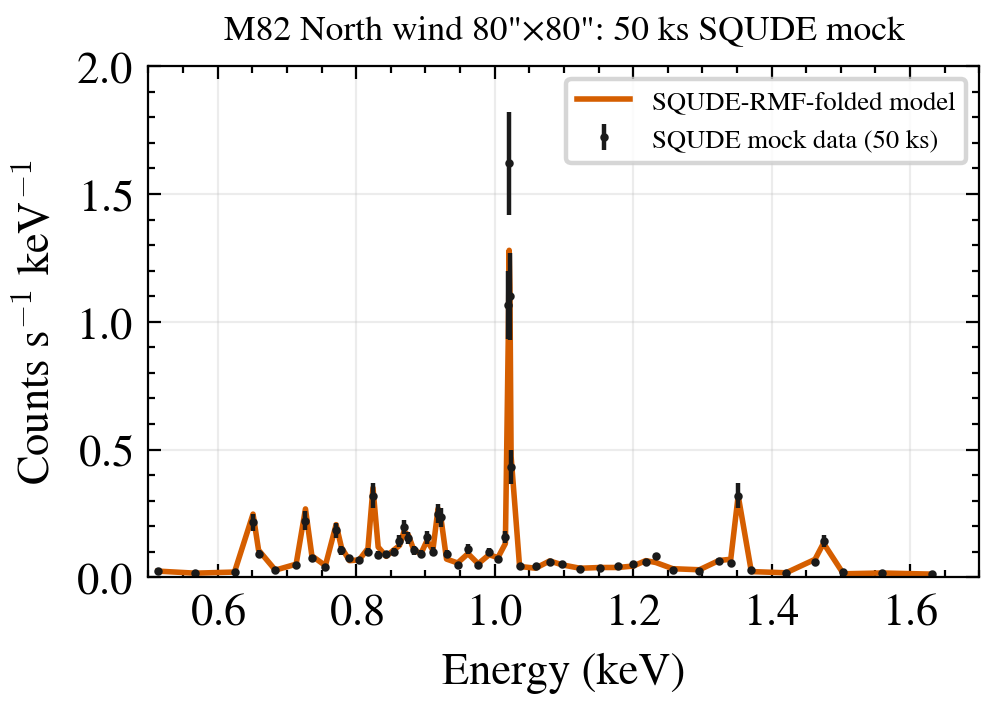
The three figures are deliberately separated. Figure 1 contains only Chandra data, the Chandra-RMF-folded total model, and its response-folded model components; Figure 2 contains only SQUDE mock data and its SQUDE-RMF model; Figure 3 is the only common-axis comparison of SQUDE mock data, SQUDE model, and Chandra-RMF model. No empirical polynomial or image-level scaling is used.
fake_pha from the same Chandra best-fit source model through the SQUDE ARF/RMF.1. Chandra ACIS data + total model + model components
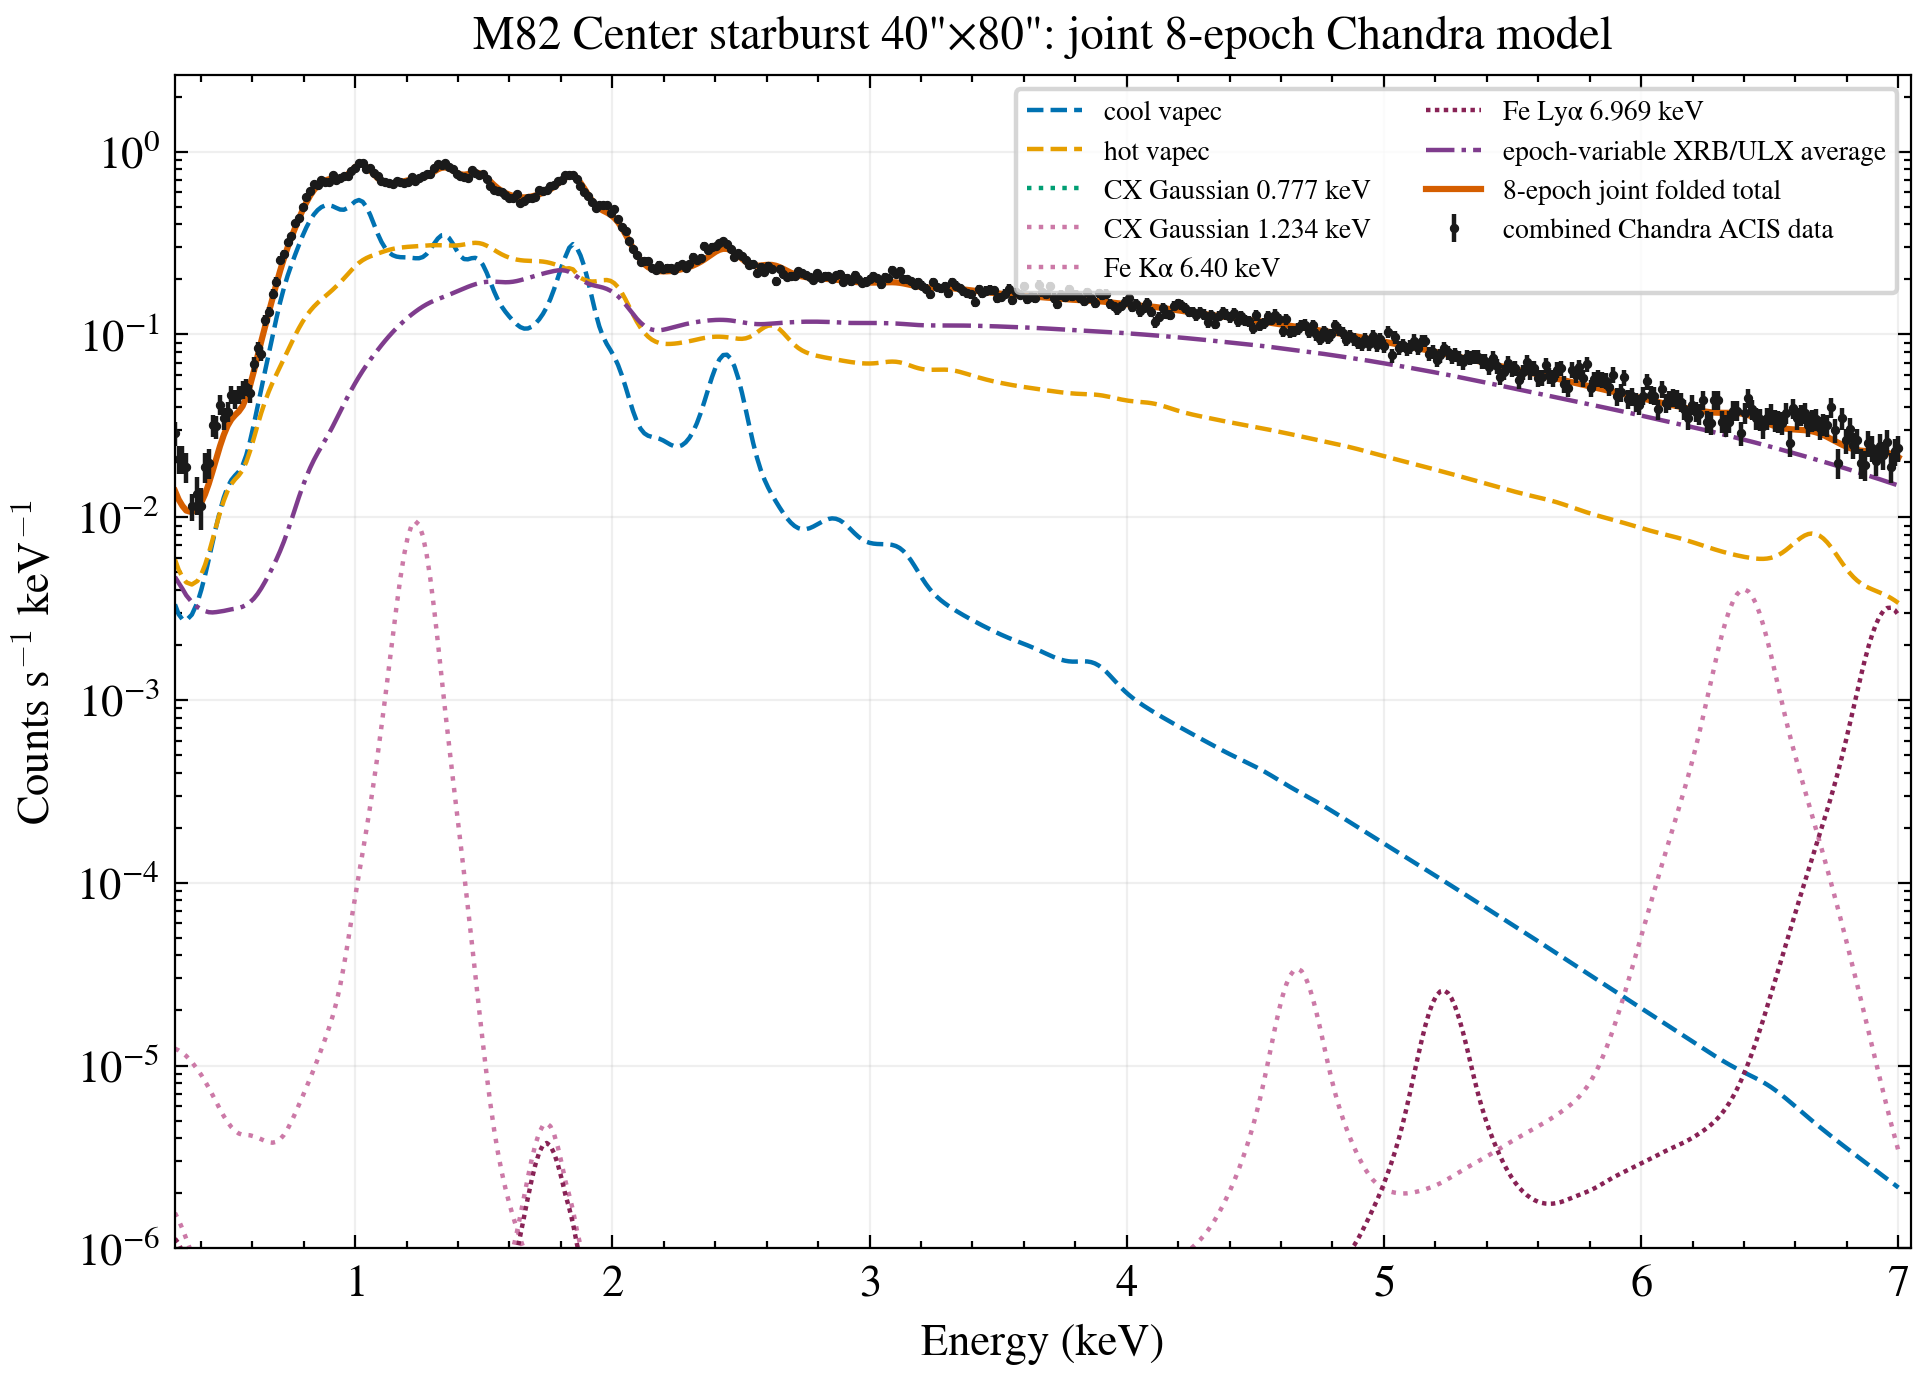
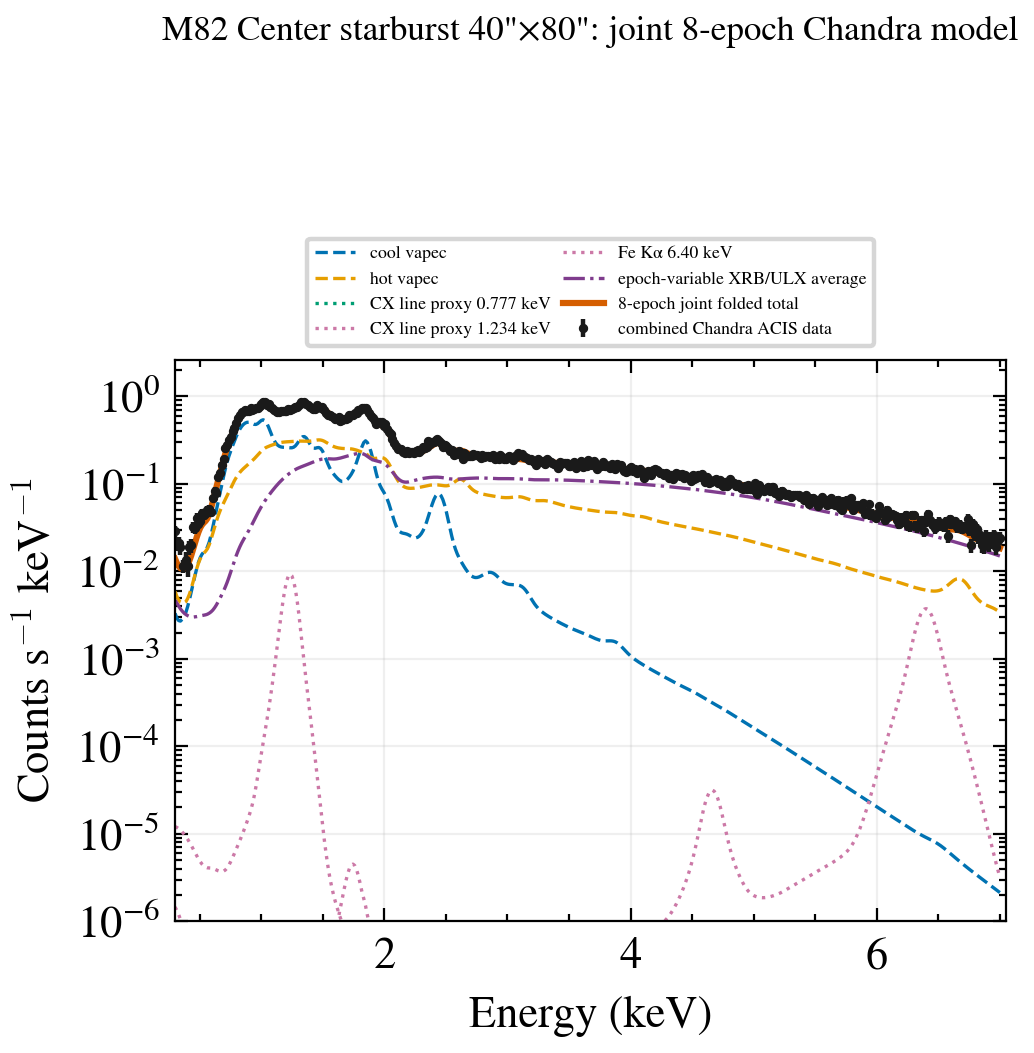
This is the original combined 4′×4′ Chandra ACIS spectrum: it contains no SQUDE mock data or SQUDE response. Black points are Chandra data; orange is the total model forward-folded through the Chandra RMF and rate-conservingly rebinned onto the same 458 data bins. Dashed/dotted curves are the five model components; each is independently folded through the same Chandra response and rebinned to the data bins, rather than plotted as an unconvolved source spectrum.
Download 1-column PNGDownload 2-column PNG
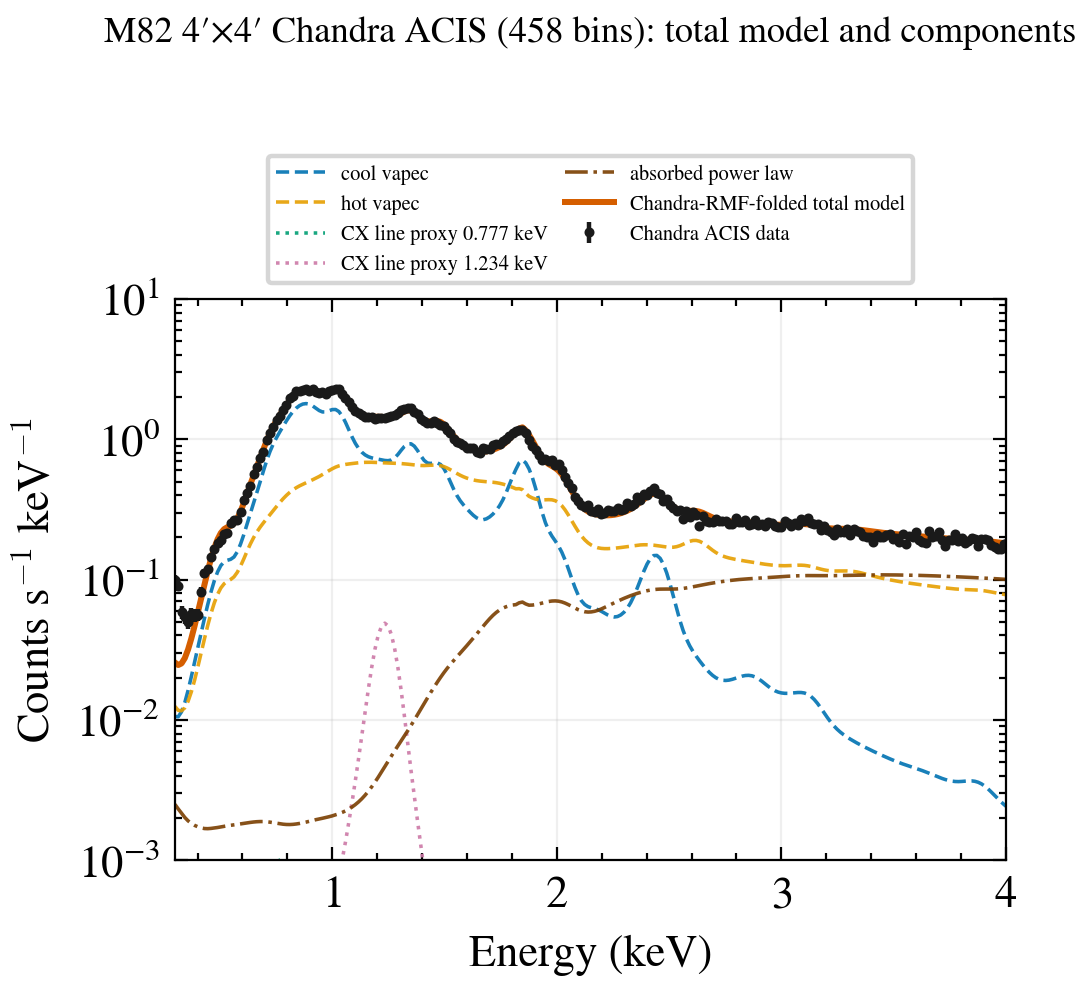
χ²_Gehrels/dof = 1125.65/444 = 2.535. It is a reproducible response-propagation input, not a final publication-grade M82 physical fit; the component curves only expose model decomposition and do not improve or hide this limitation.2. SQUDE mock data + SQUDE model
The fitted source from Figure 1 is passed through SQUDE ARF v1.1.1 and RMF v1.1.2 using a 50 ks fake_pha. The Sherpa UI-session Poisson RNG is fixed by set_rng(numpy.random.default_rng(20260719)); this reproducible realization has 58,298 raw counts. The original uses group_counts(50); the new min30 version reuses the identical raw PHA and changes only the display layer to group_counts(30). Both are linear–linear.
set_rng(numpy.random.default_rng(20260719))
set_source(2, chandra_bestfit_model)
fake_pha(2, arf="SQUDE_rsp_v1.1.1.arf", rmf="SQUDE_rsp_v1.1.2.rmf",
         exposure=50000.0, grouped=False, method=poisson_noise)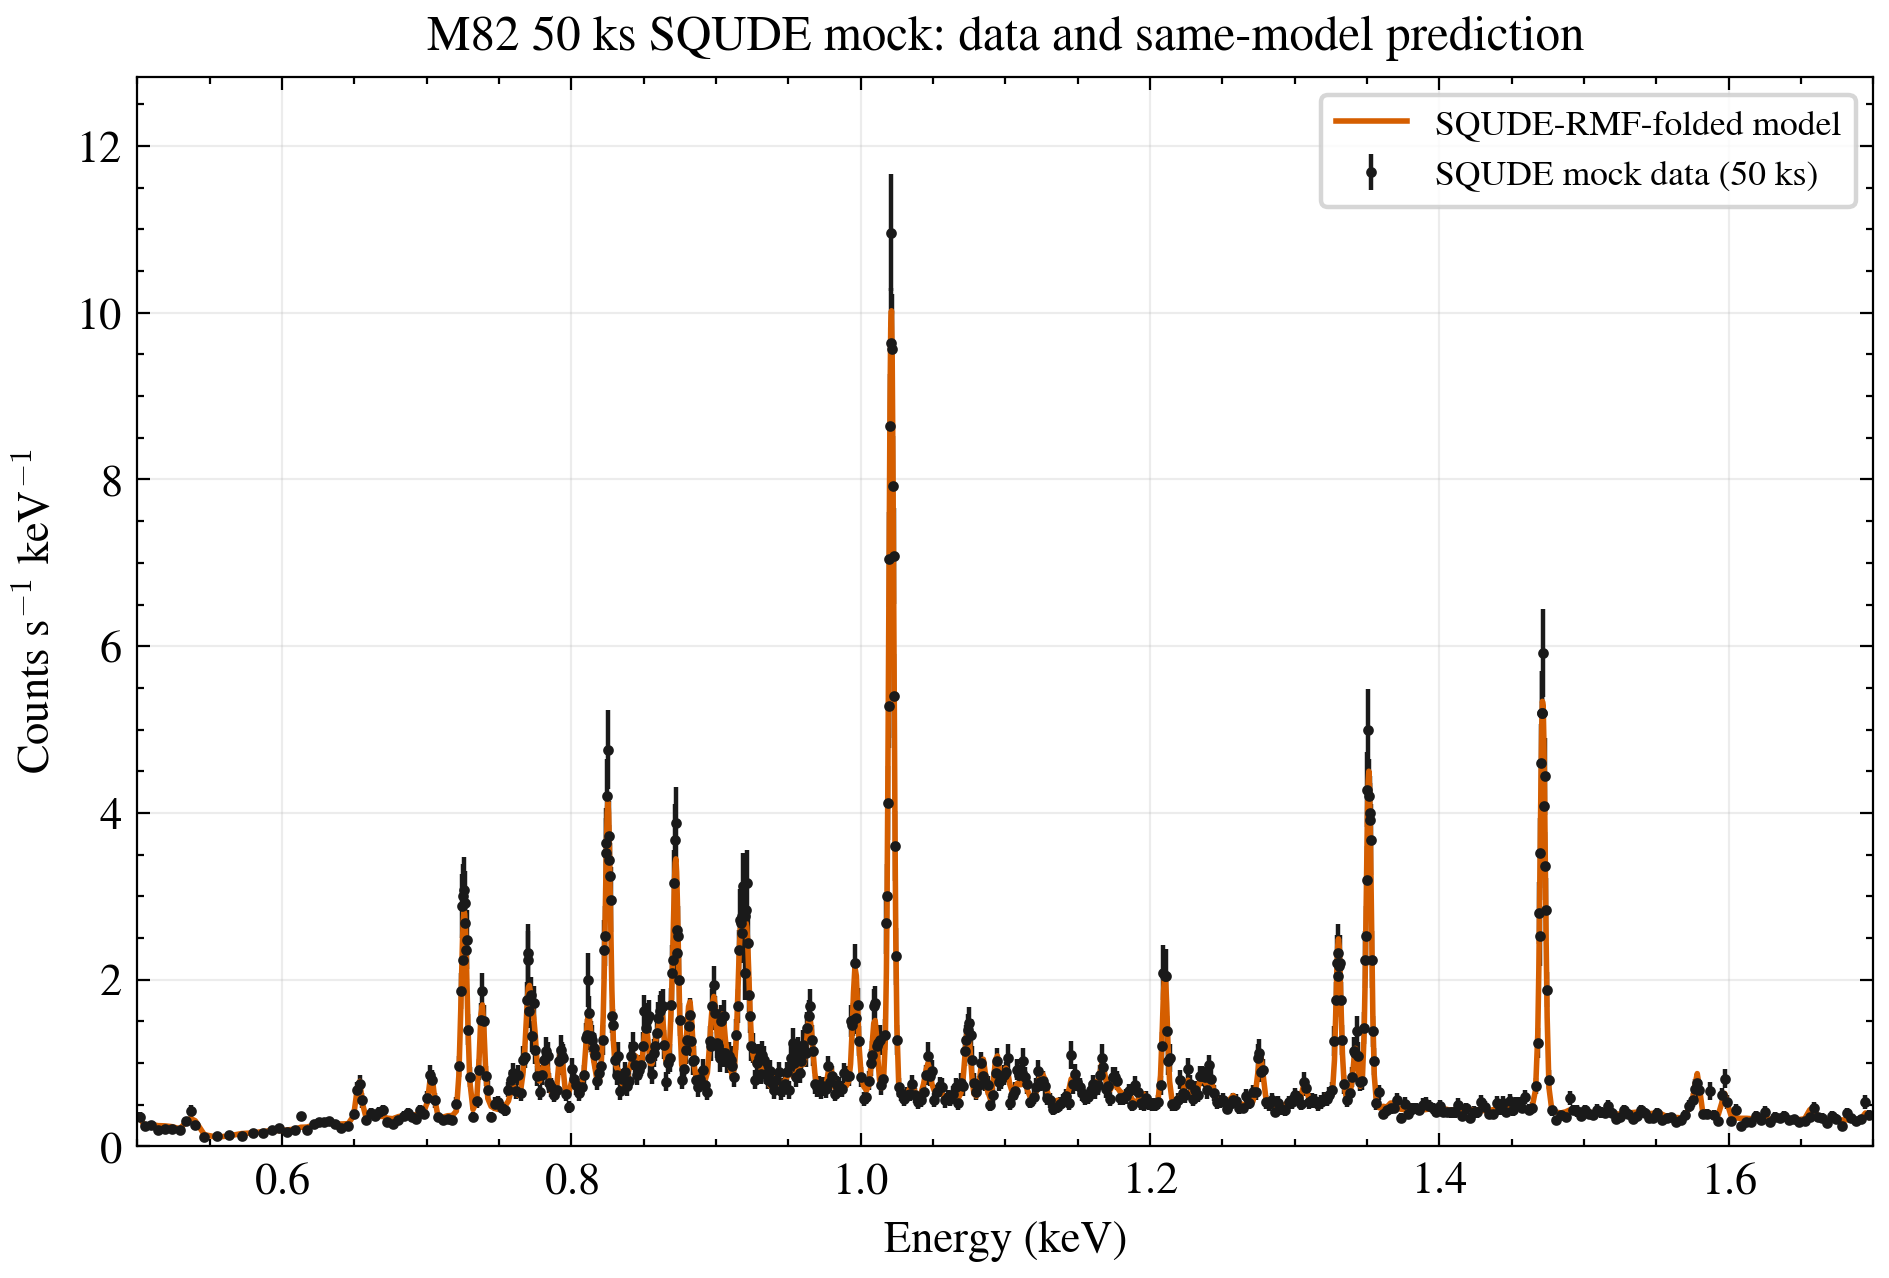
3. SQUDE mock + SQUDE model + Chandra-RMF model
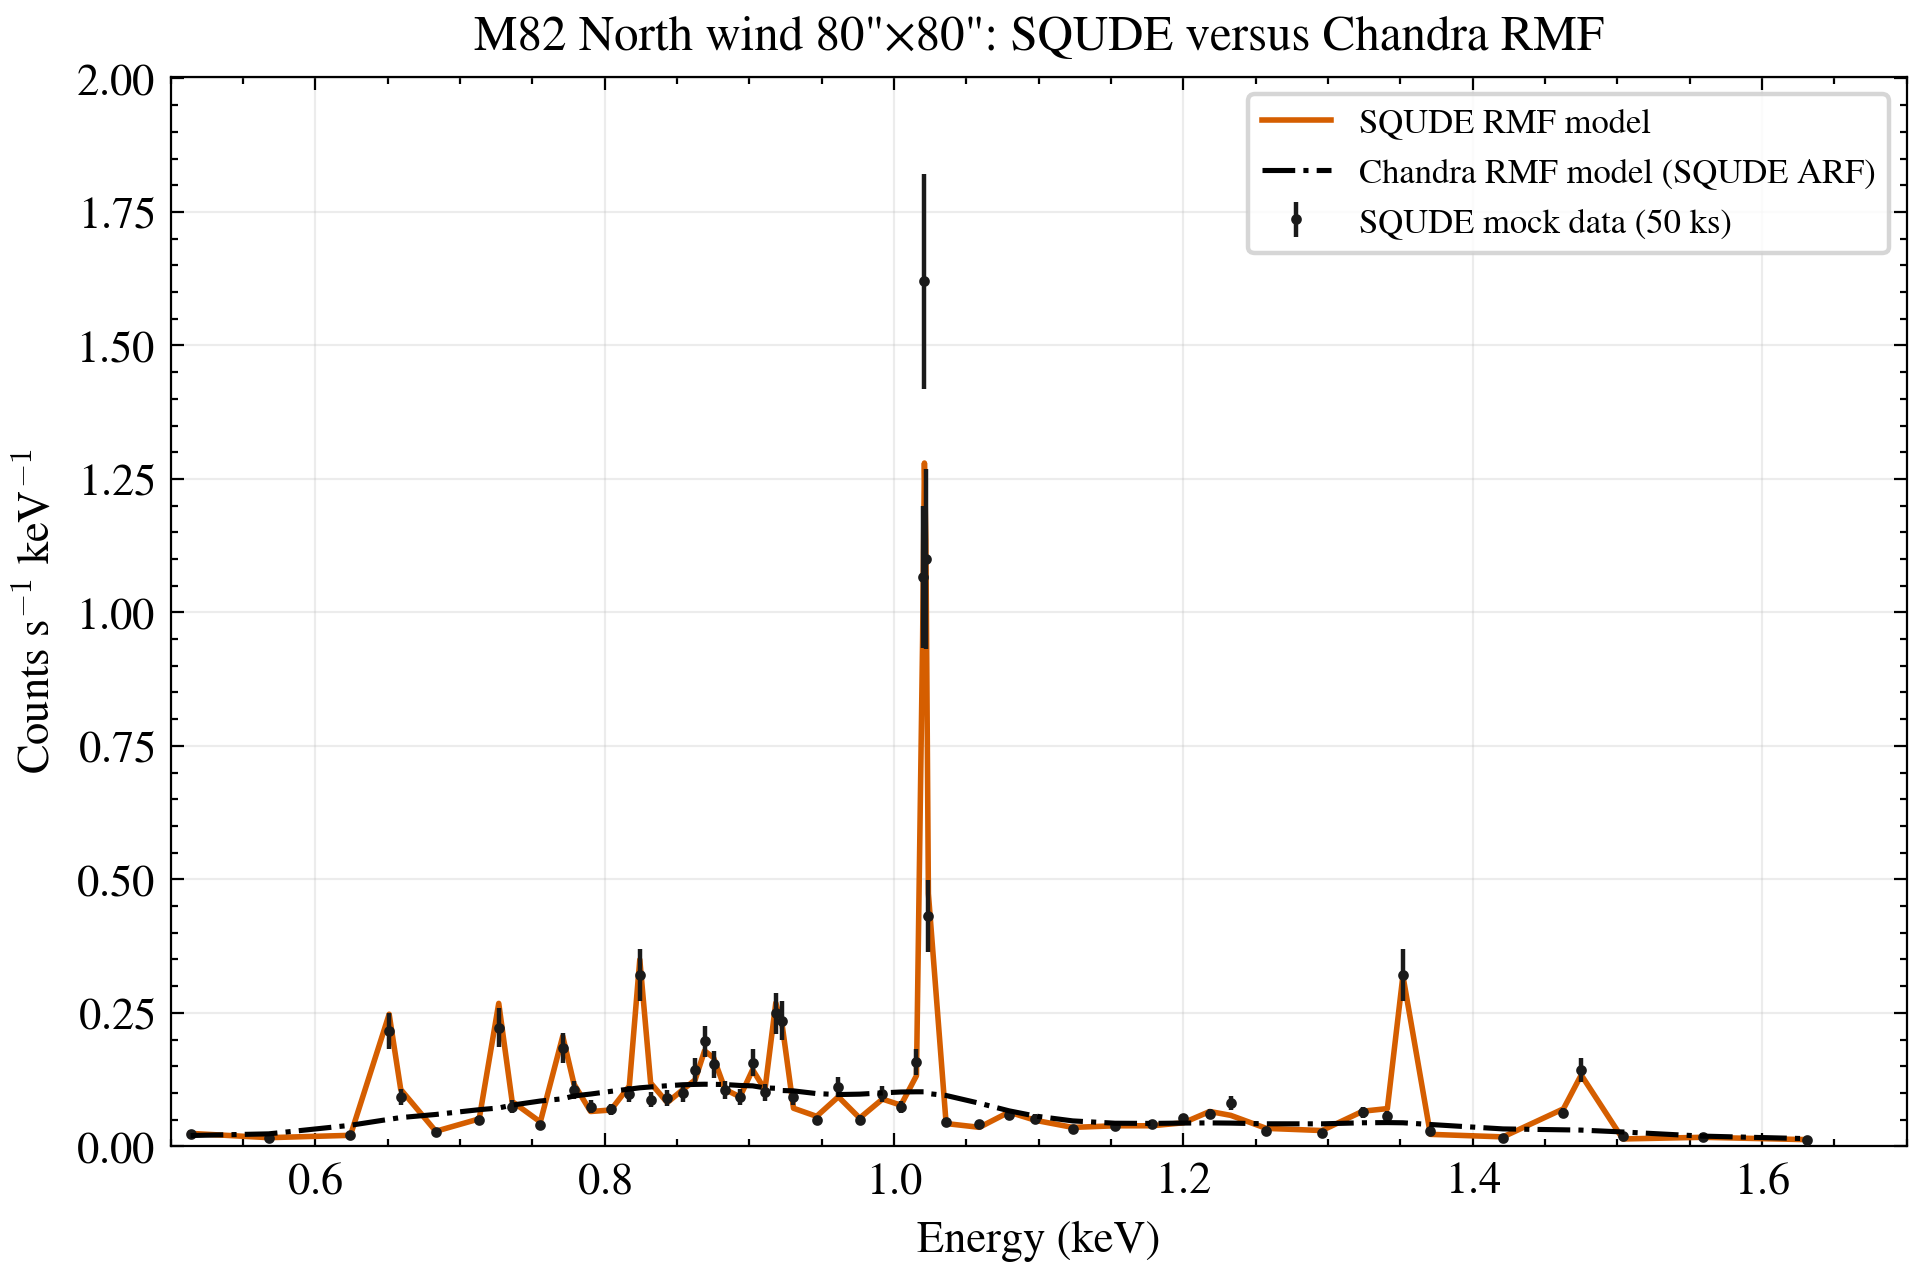
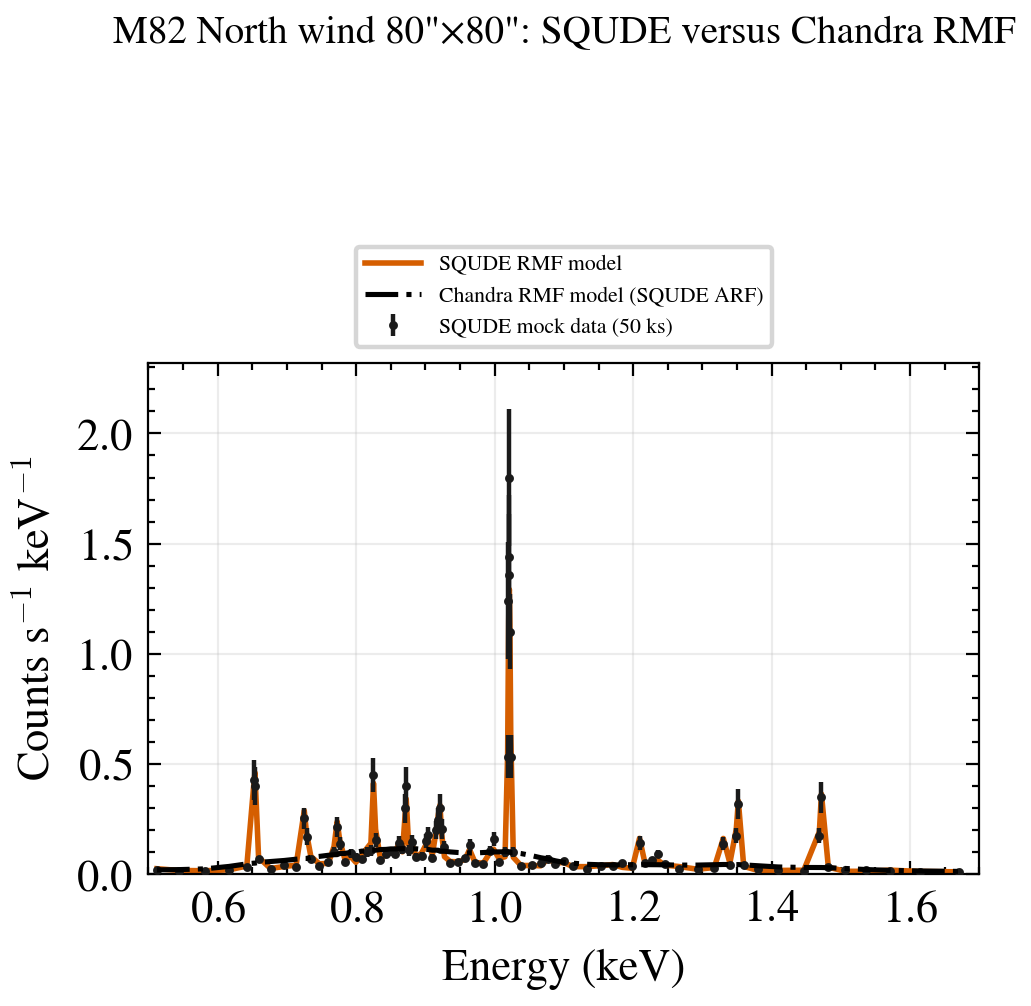
This is the full-aperture three-object comparison; each regional section below now has a separate analogue. Black points remain the Figure-2 SQUDE mock data; orange remains the SQUDE-RMF model; black dash-dot is the same best-fit source redistributed through the Chandra RMF. Both models retain the same SQUDE ARF, so the difference is RMF redistribution only.
 min30 · 30 counts/binmin50 · 50 counts/bin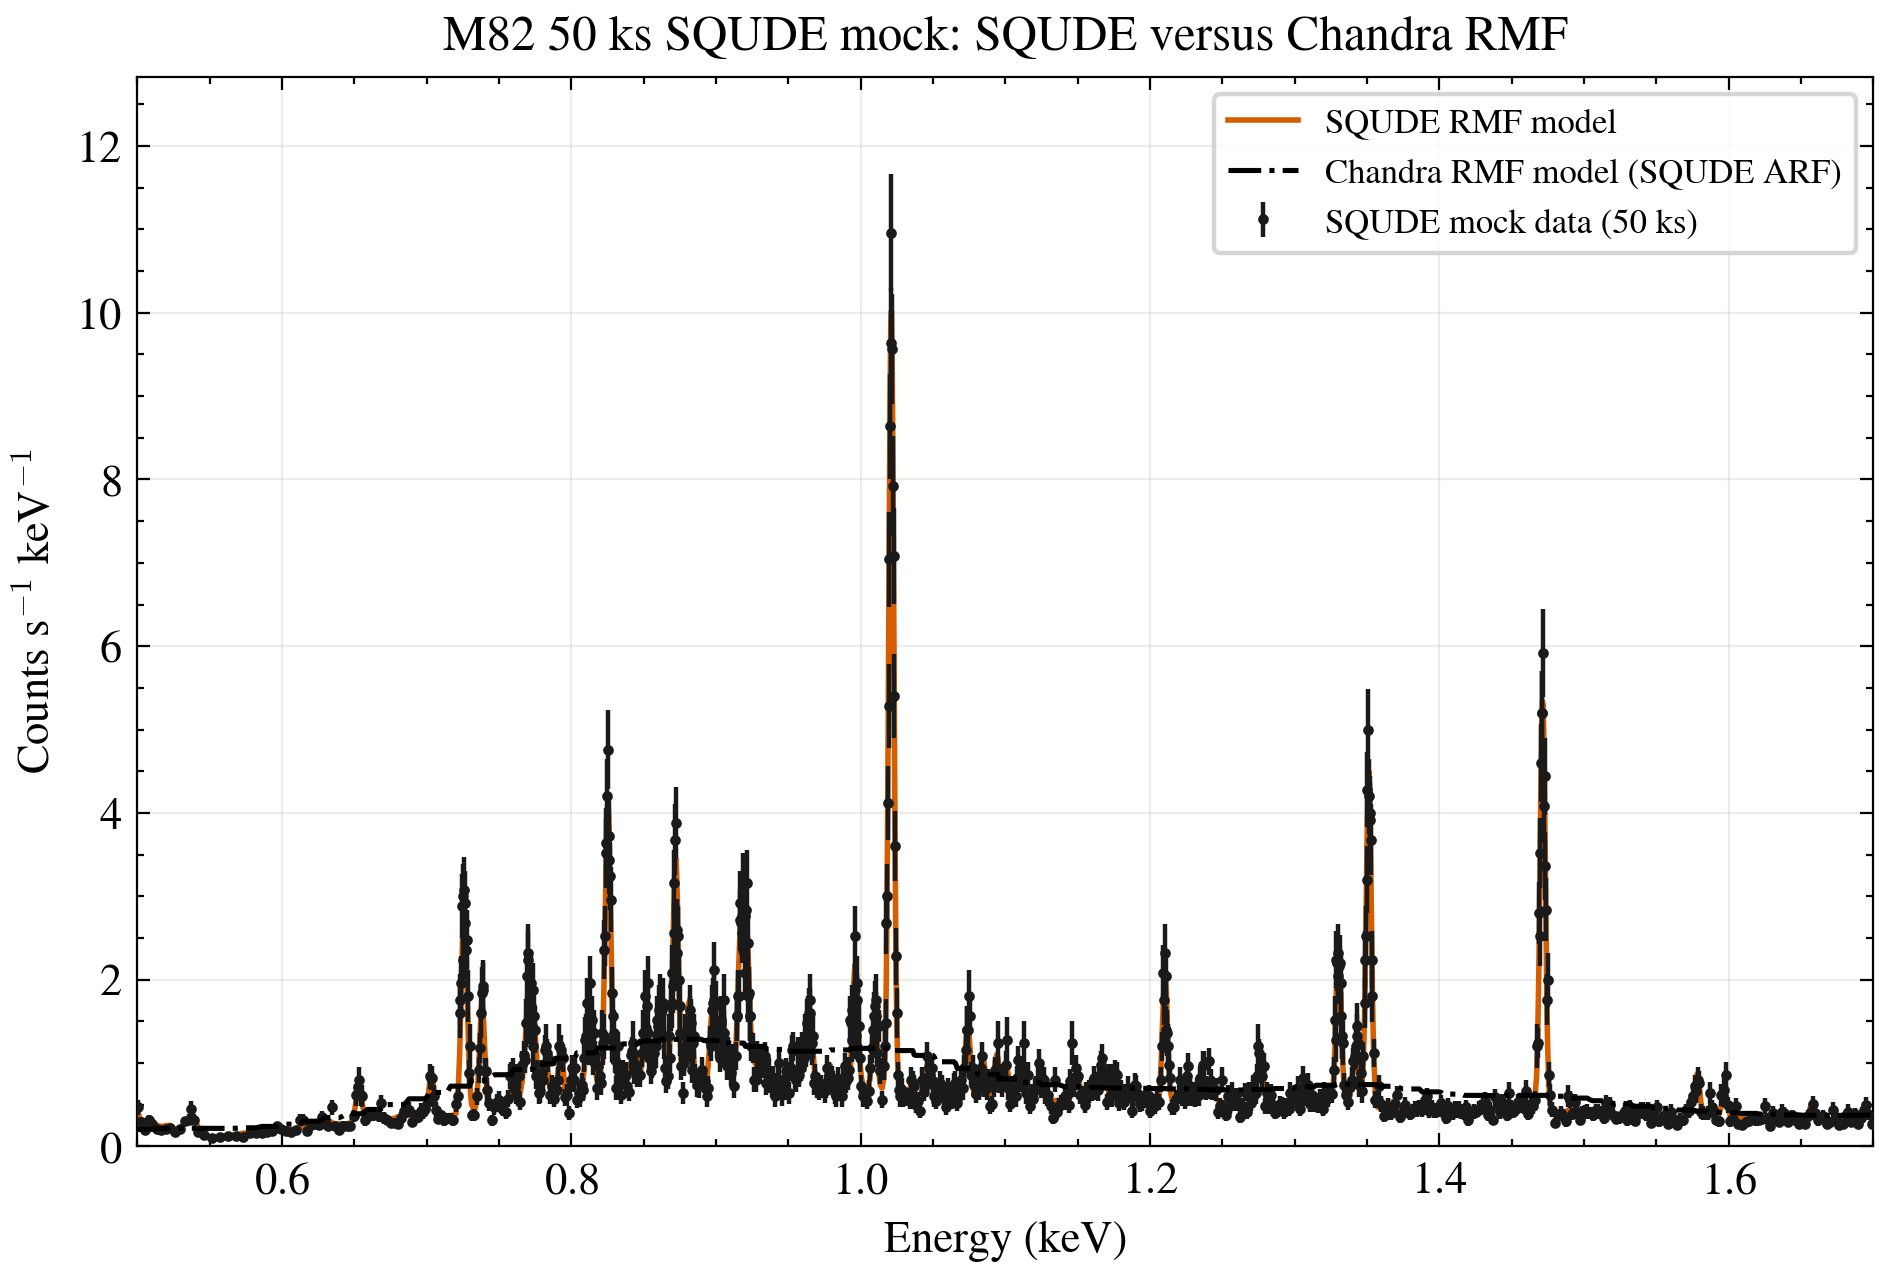
min50 1-columnmin50 2-columnmin30 1-columnmin30 2-columnDownload grouping-independent native model-grid CSV
4. Connected spectrum: SQUDE mock versus CCD resolution
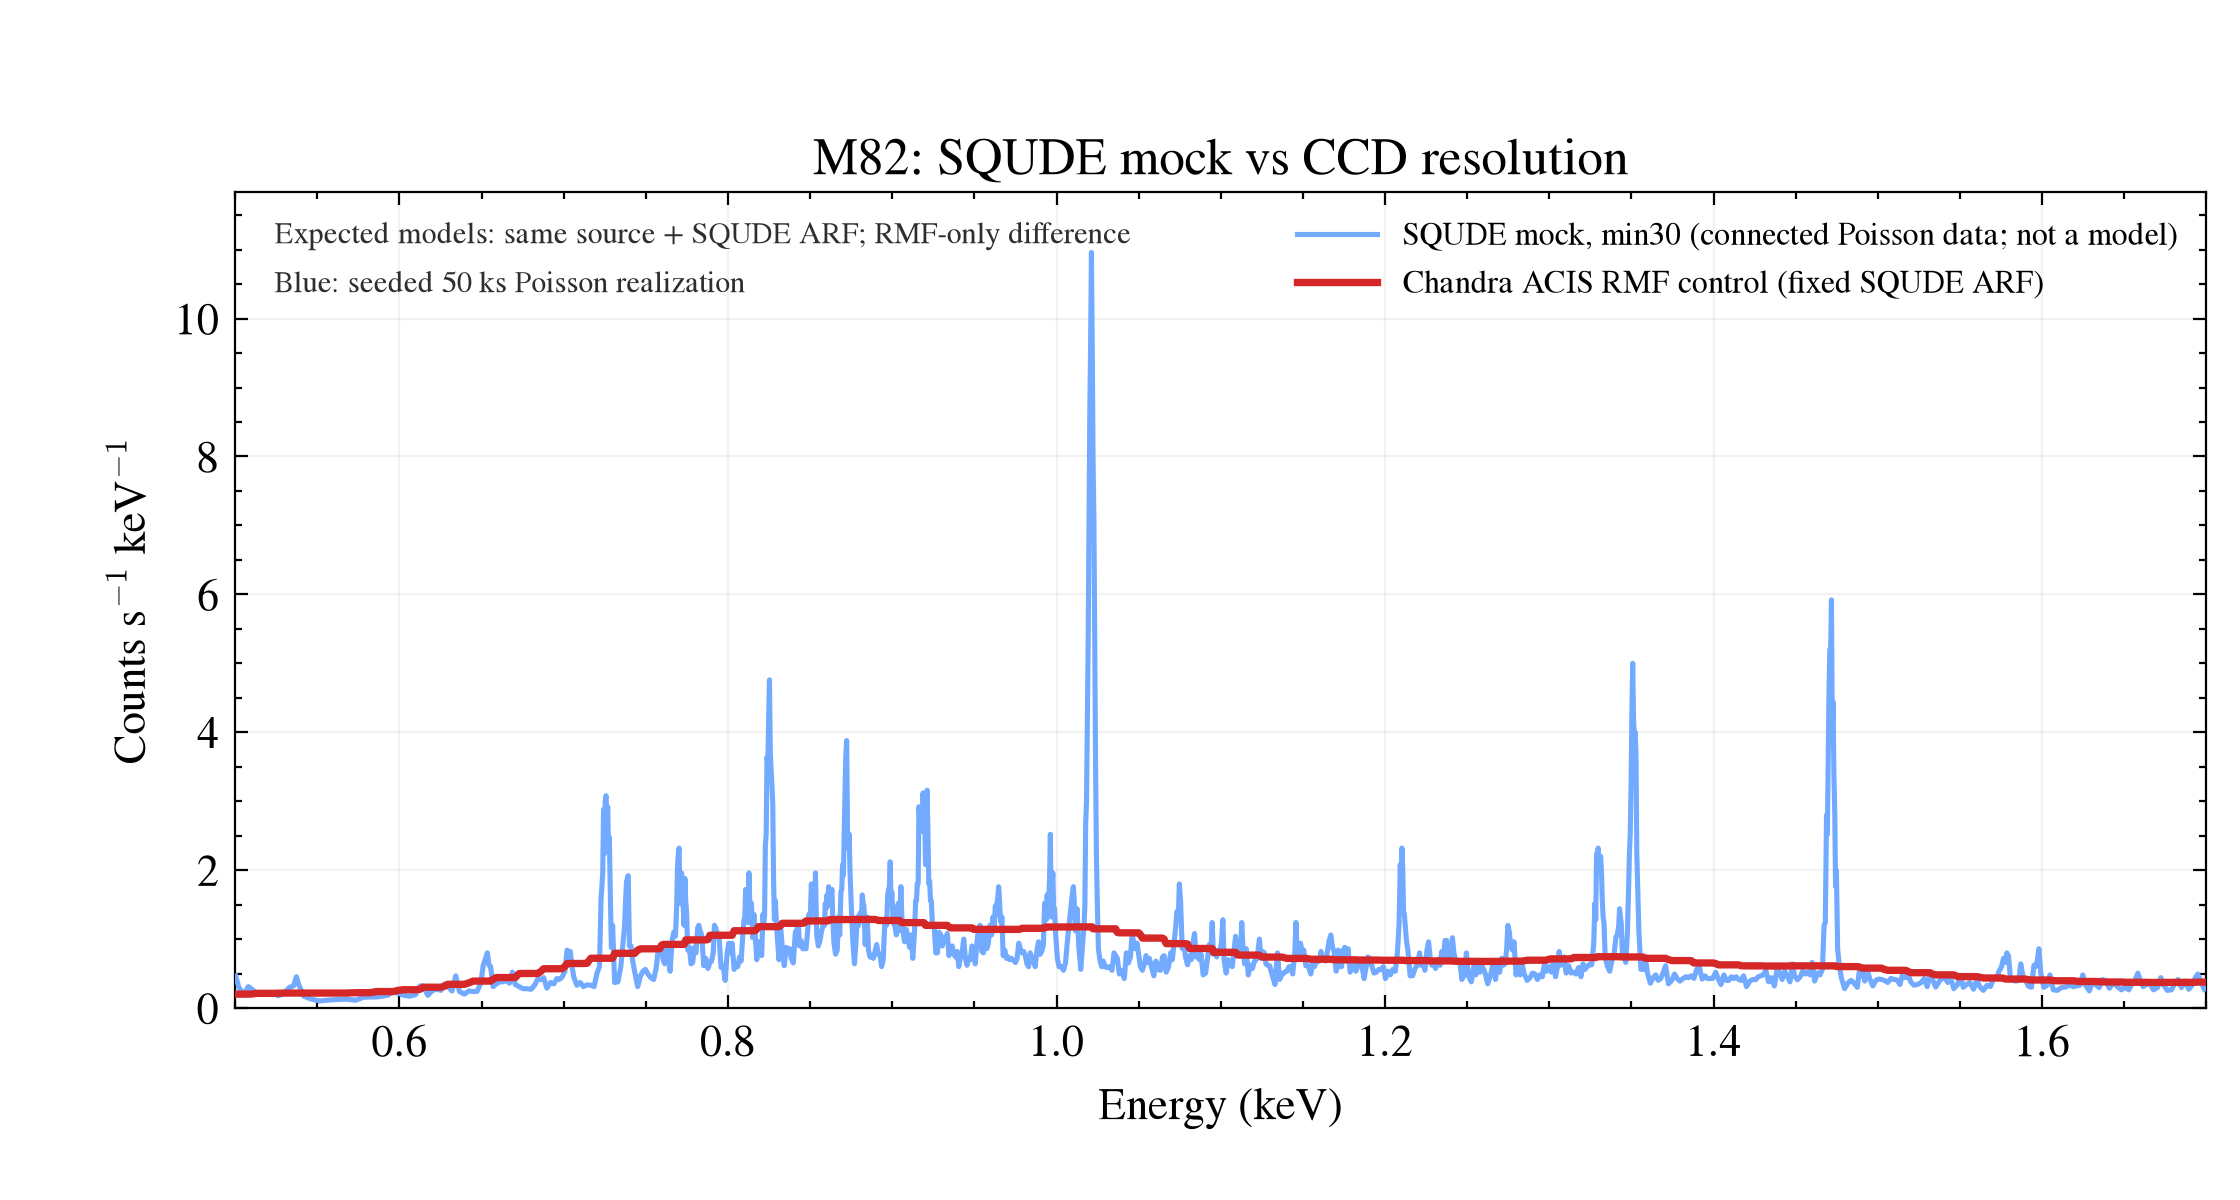
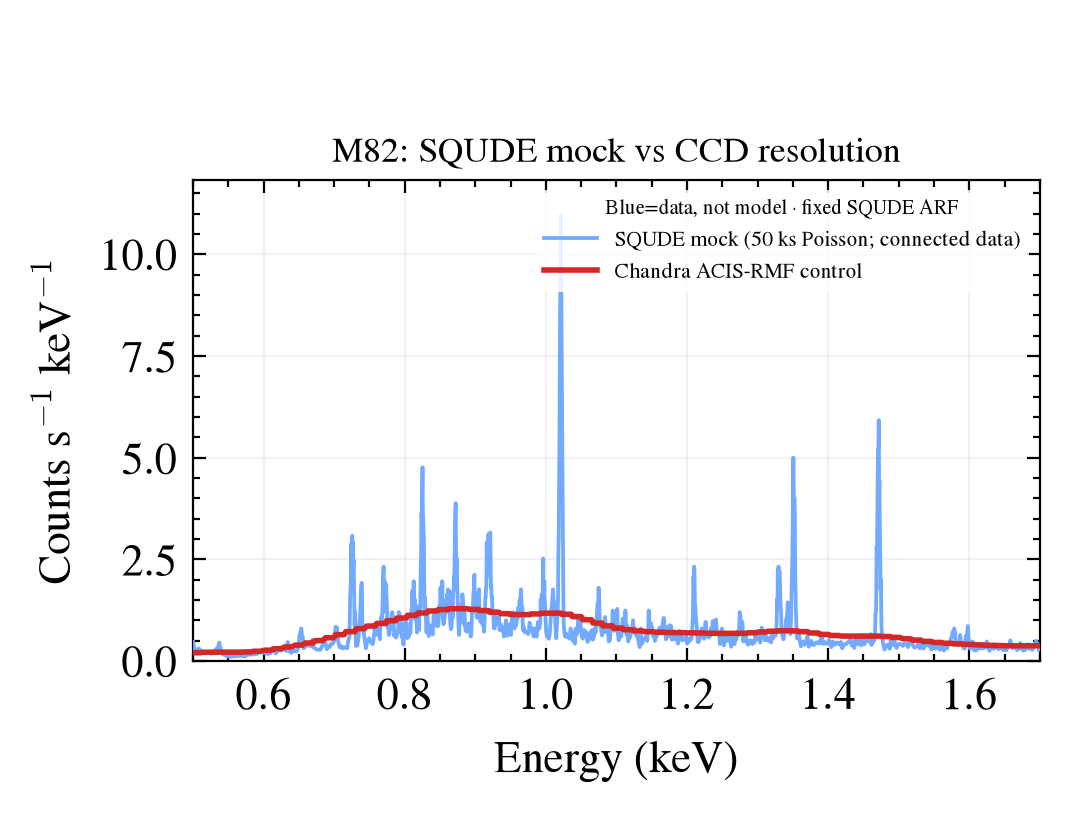
This is an additional presentation and does not replace Figures 1–3 or the grouping sliders above. The blue curve directly joins the 971 display-bin centers of the same seeded 50 ks min30 SQUDE Poisson mock; it is a data realization, not a model, and has no error bars. The red curve is the deterministic control for the same source and fixed SQUDE ARF with Chandra ACIS RMF redistribution, evaluated on exactly the same energy grid. The expected response models differ only in RMF; the displayed blue realization also contains Poisson noise, grouping, and unequal-bin rate-density effects. The red curve is not a Chandra-data spectrum, and this figure is not evidence for fit quality, physical parameters, or individual line identifications.
Connected contrast 1-columnConnected contrast 2-columnDownload V5 manifestDownload V5 producer
4L. Connected spectrum labeled V2: 25 AtomDB/SQUDE keV reference guides
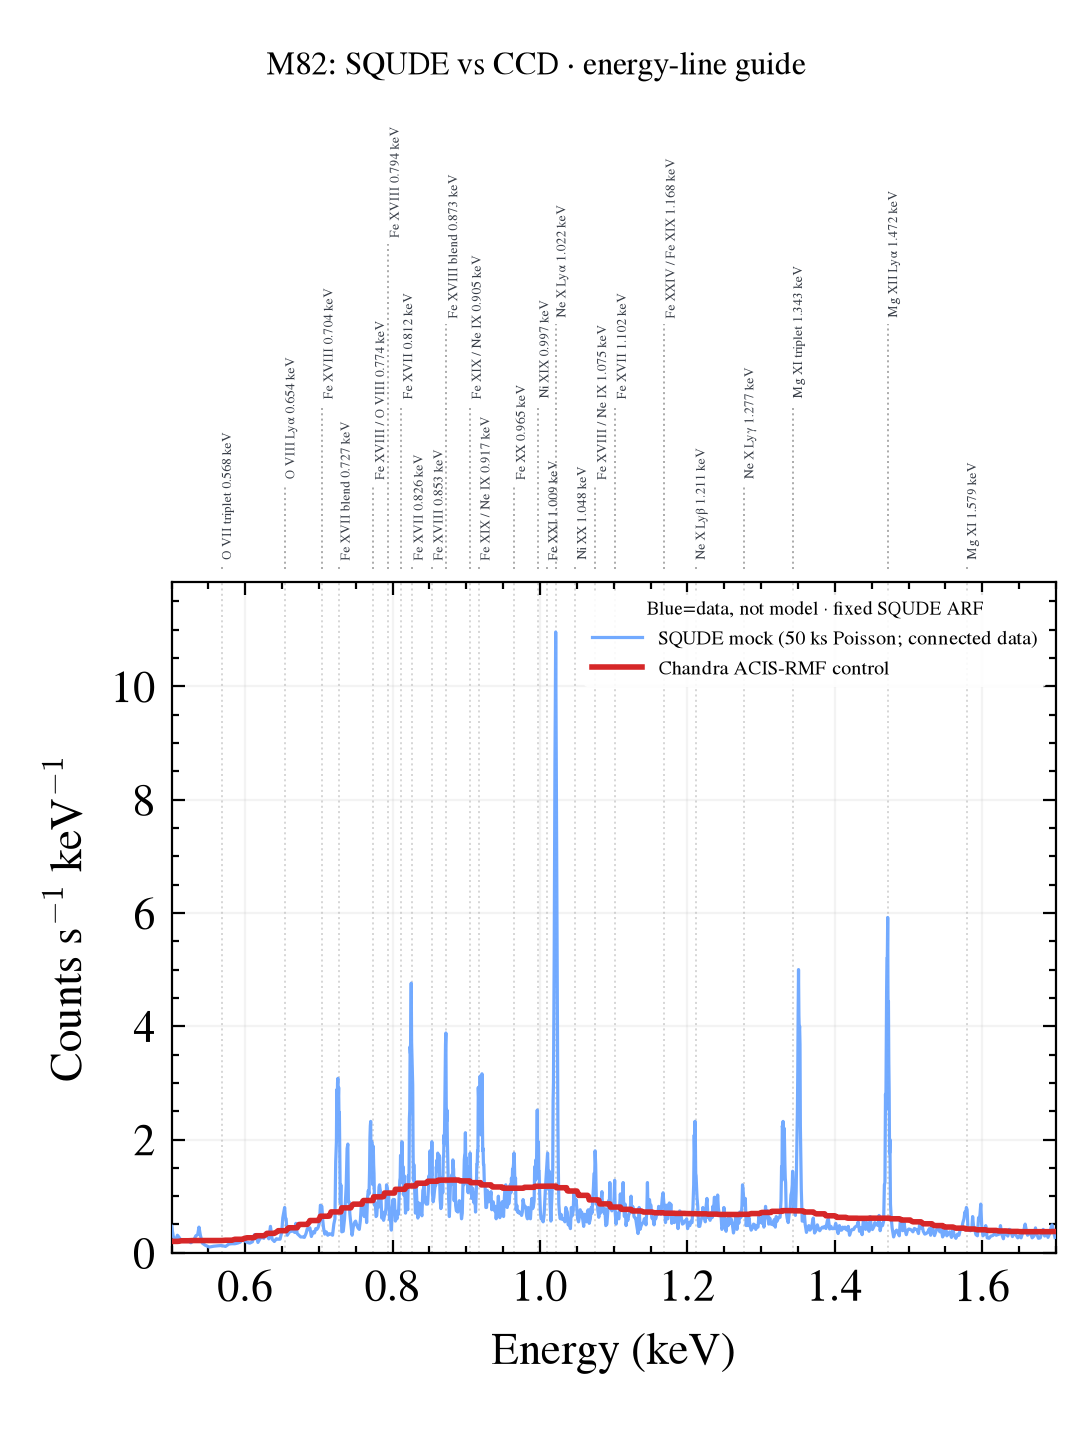
This is the annotation-only companion V2 to Figure 4 and does not replace Figure 4 or any figure, slider, or download above; the V1 labeled version (eight wavelength text labels placed over the data panel) remains in the bundle but is intentionally superseded. The blue Poisson connected line and the red Chandra-ACIS-RMF control curve are byte-for-byte identical to Figure 4 (same V5 plotted subset). V2 places 25 AtomDB/SQUDE keV-only grouped reference guides in a separate top annotation band above the data panel — all label text uses keV to match the x axis, and these are not independent detections or unique deblended fit assignments. The 25 guides are drawn from AtomDB 3.1.3 cross-matched to SQUDE project markers (representative dominant transitions, not a complete emissivity table), with bounded evidence provided by ../data/m82_line_label_v2_atomdb_evidence.json. The blue curve still includes Poisson noise, grouping, and unequal-bin rate-density effects; the red curve remains a deterministic response control, not a Chandra-data spectrum. This figure is not evidence for fit quality, physical parameters, or individual line identifications.
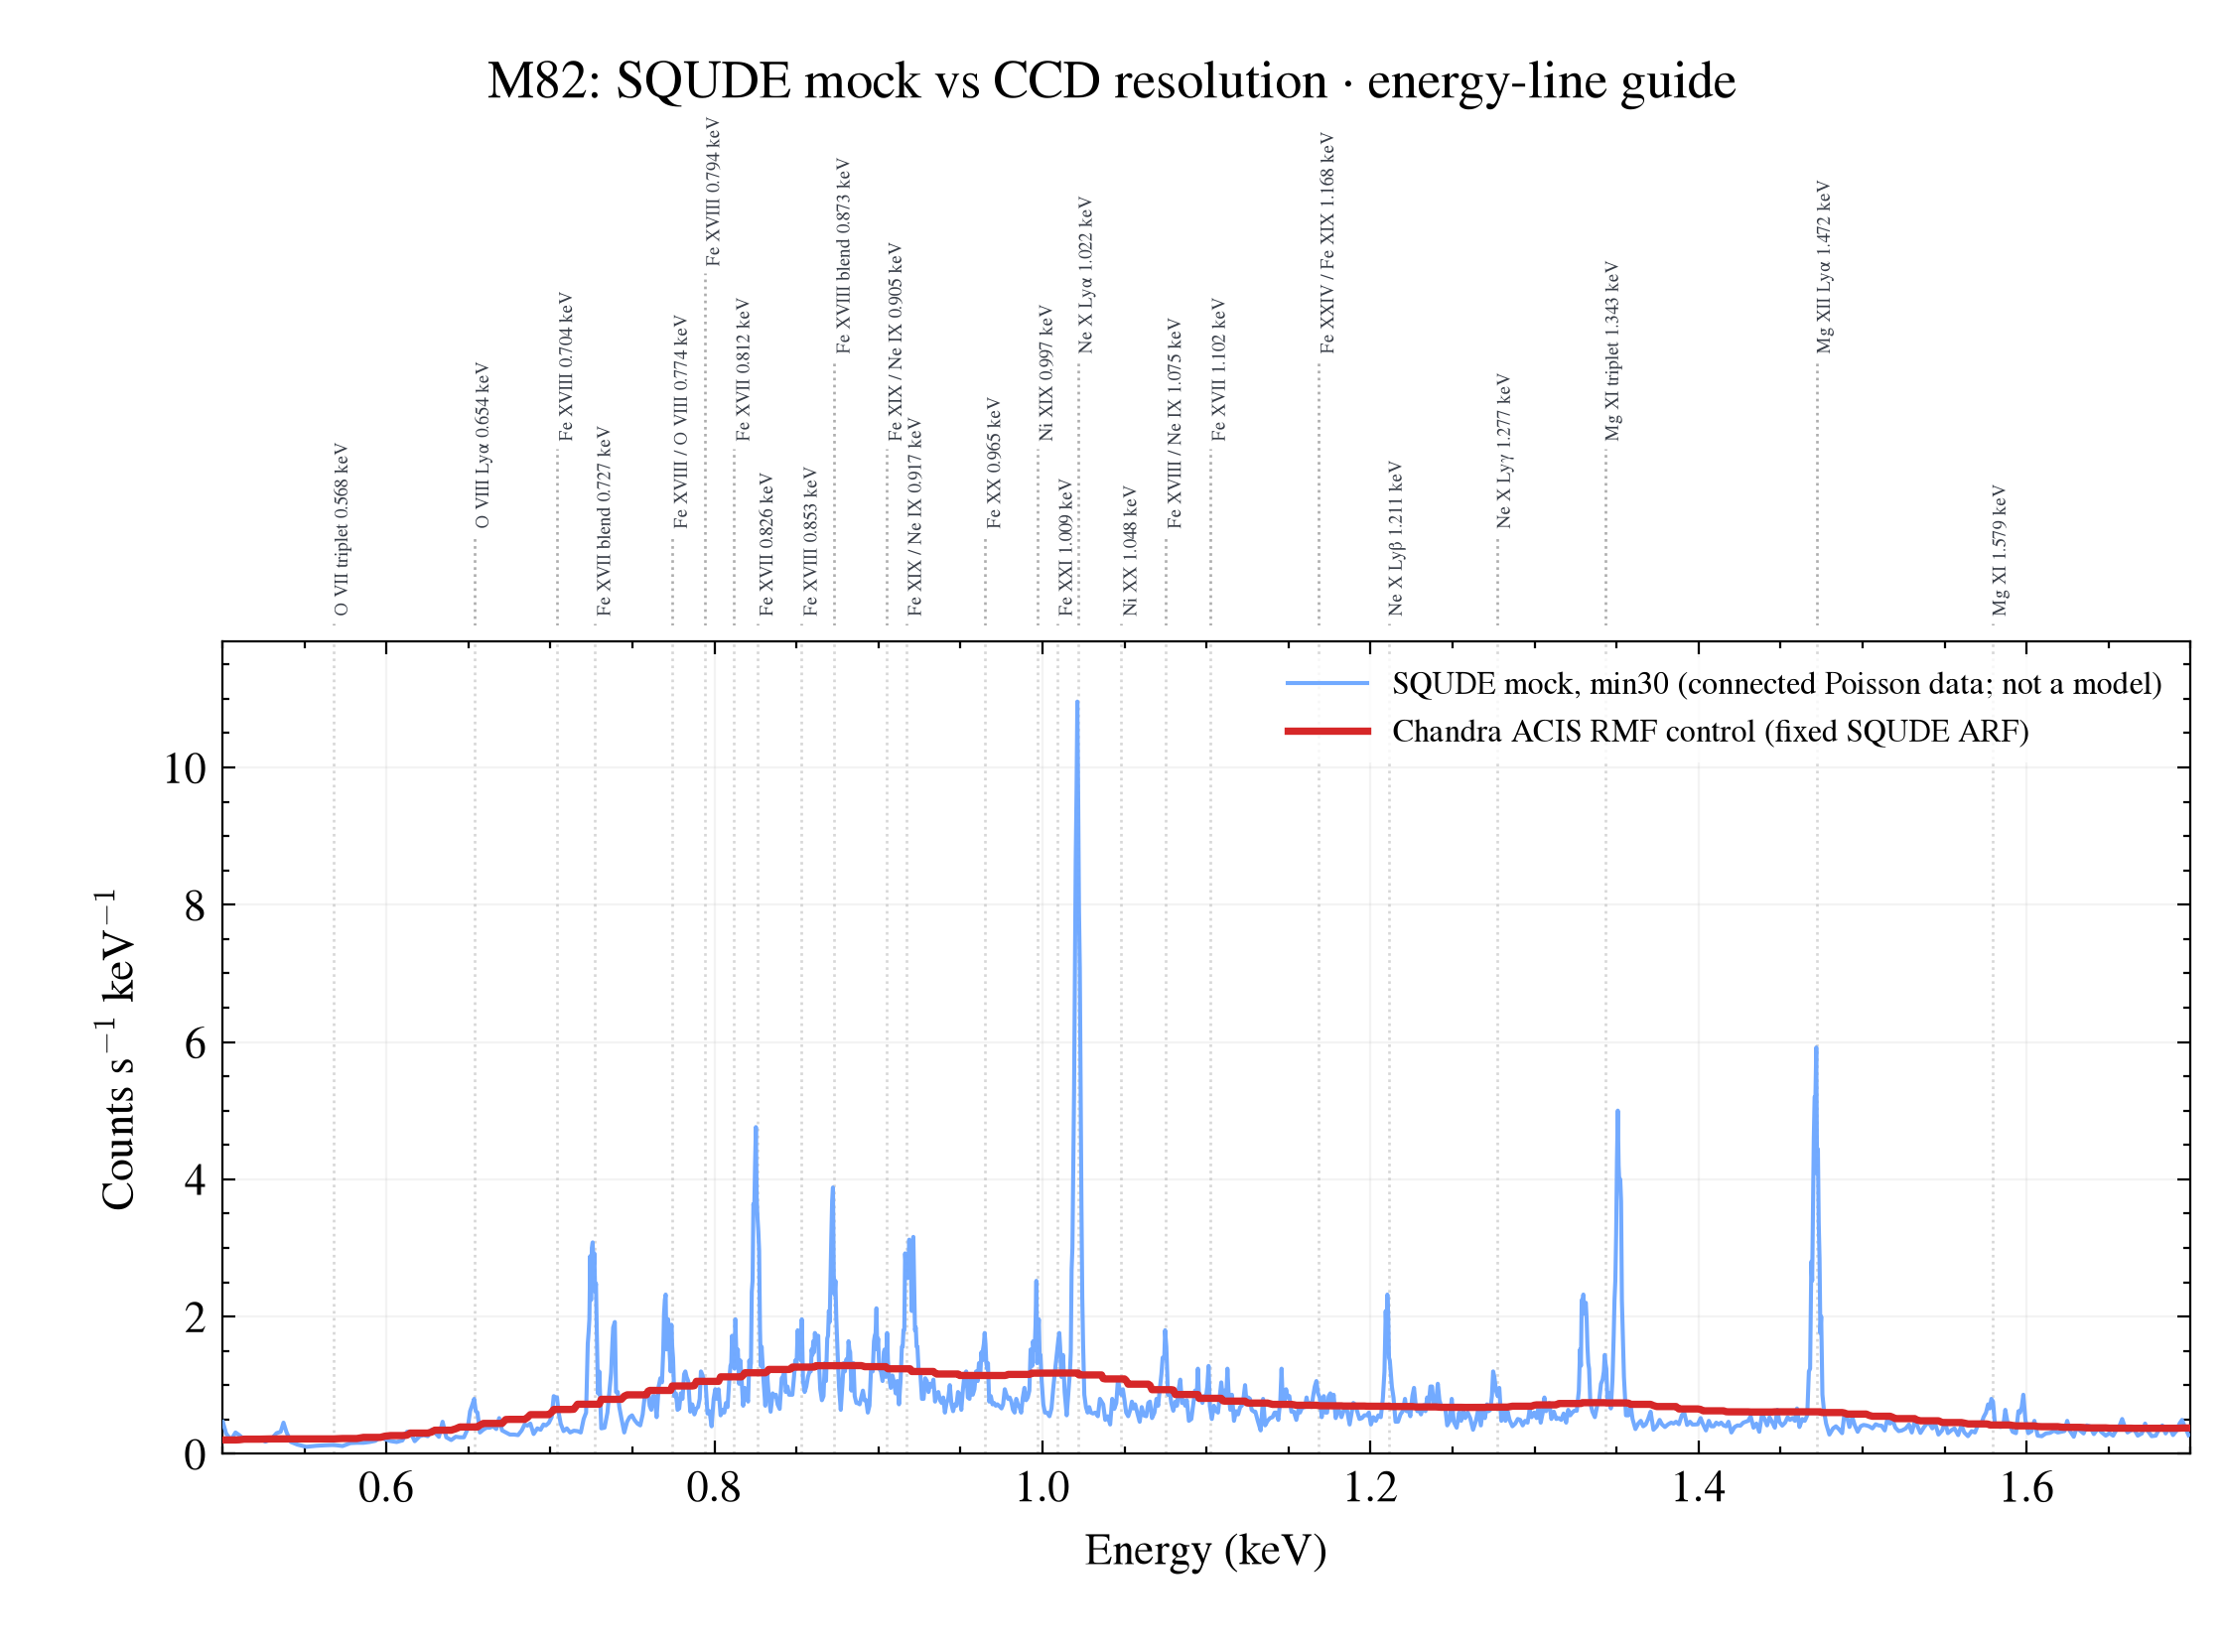
V2 labeled 1-columnV2 labeled 2-columnDownload V2 labeled manifestDownload V2 labeled producerDownload shared AtomDB bounded-evidence JSON
4R. Regional labeled V2: Center and North native-grid three-line comparison
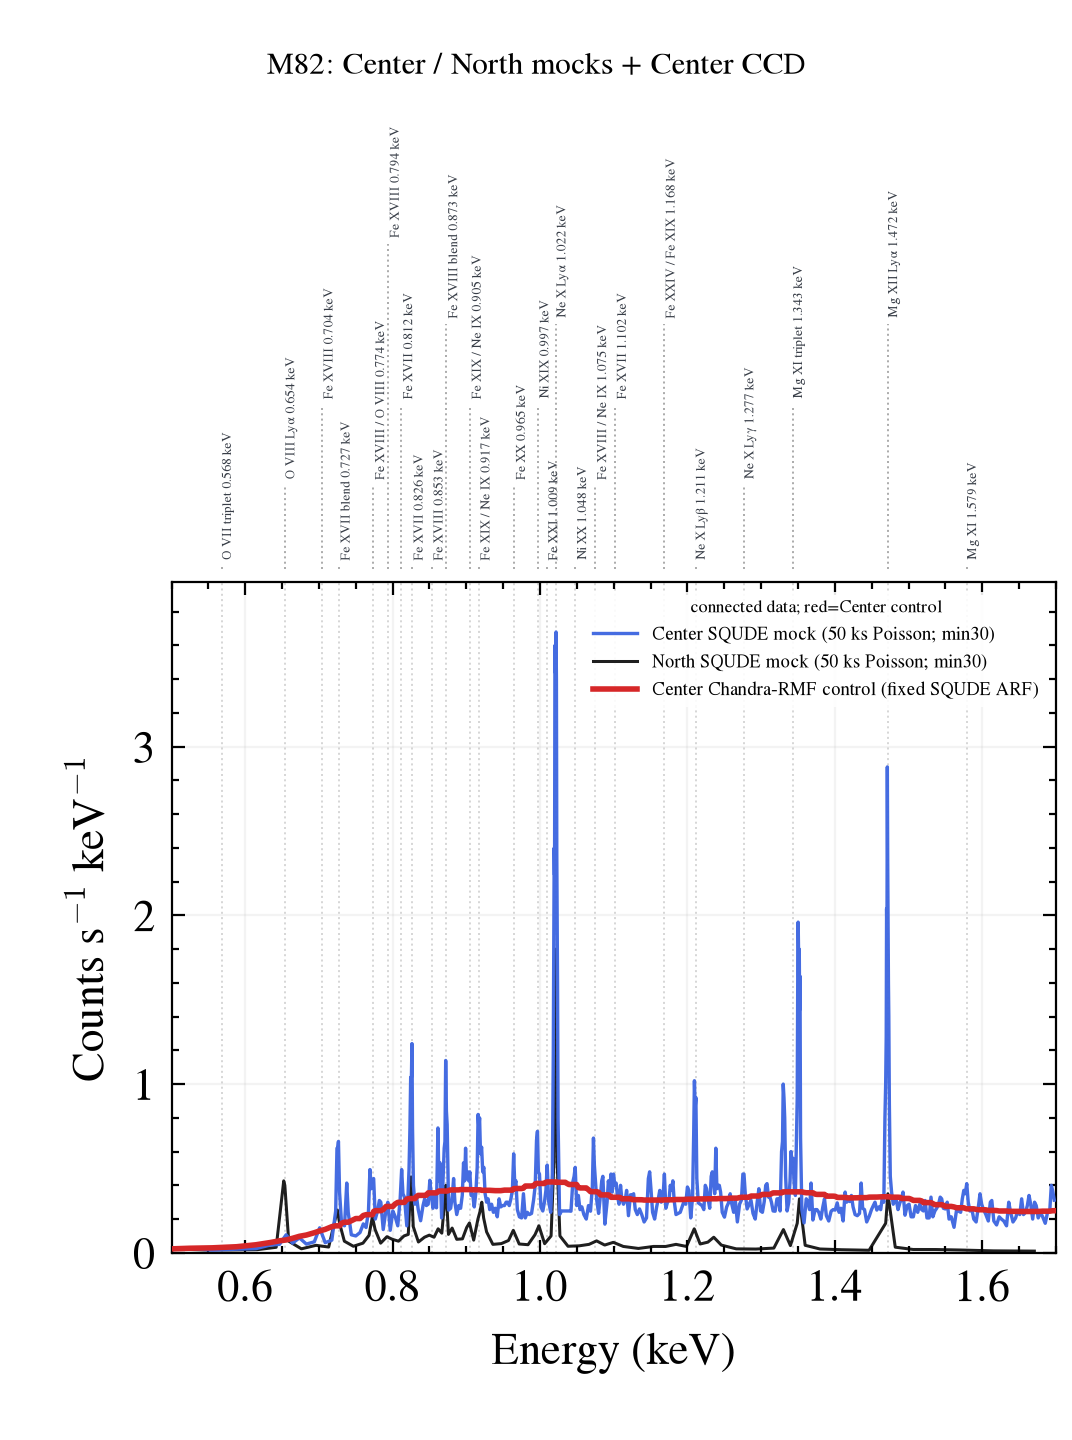
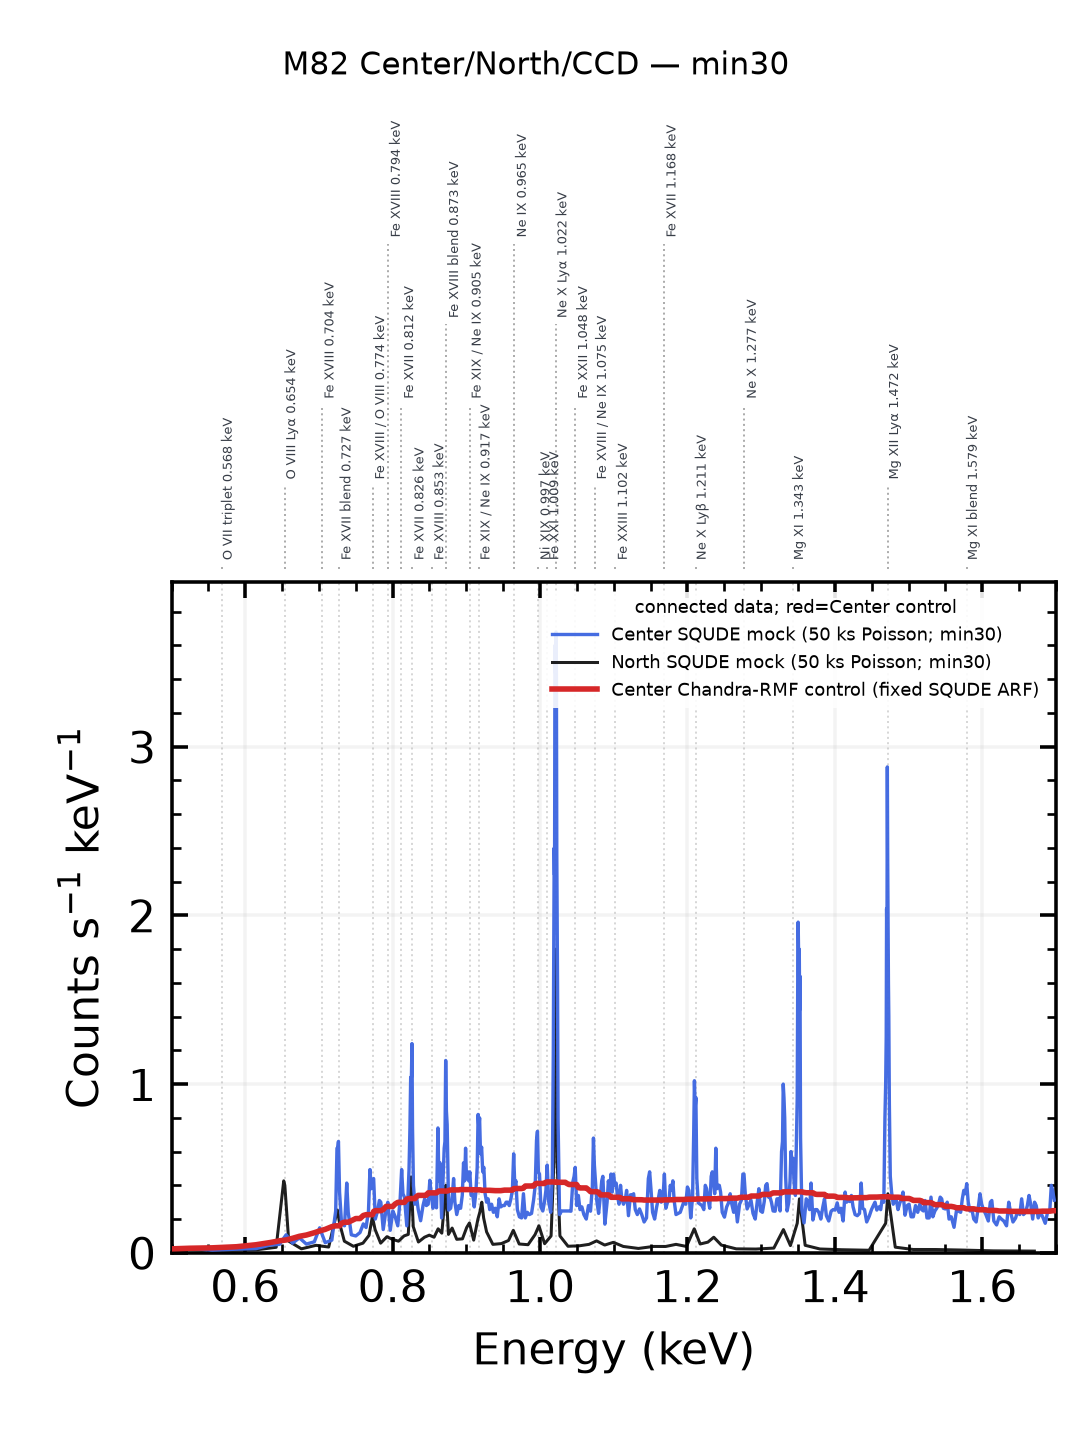
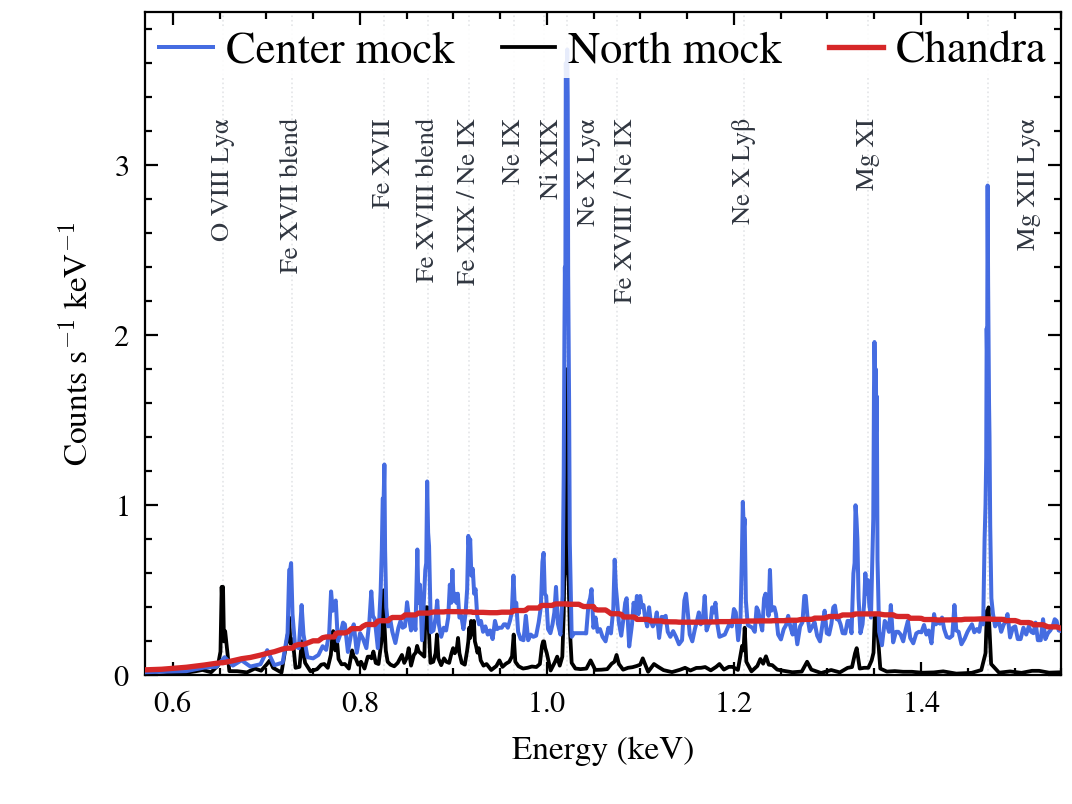
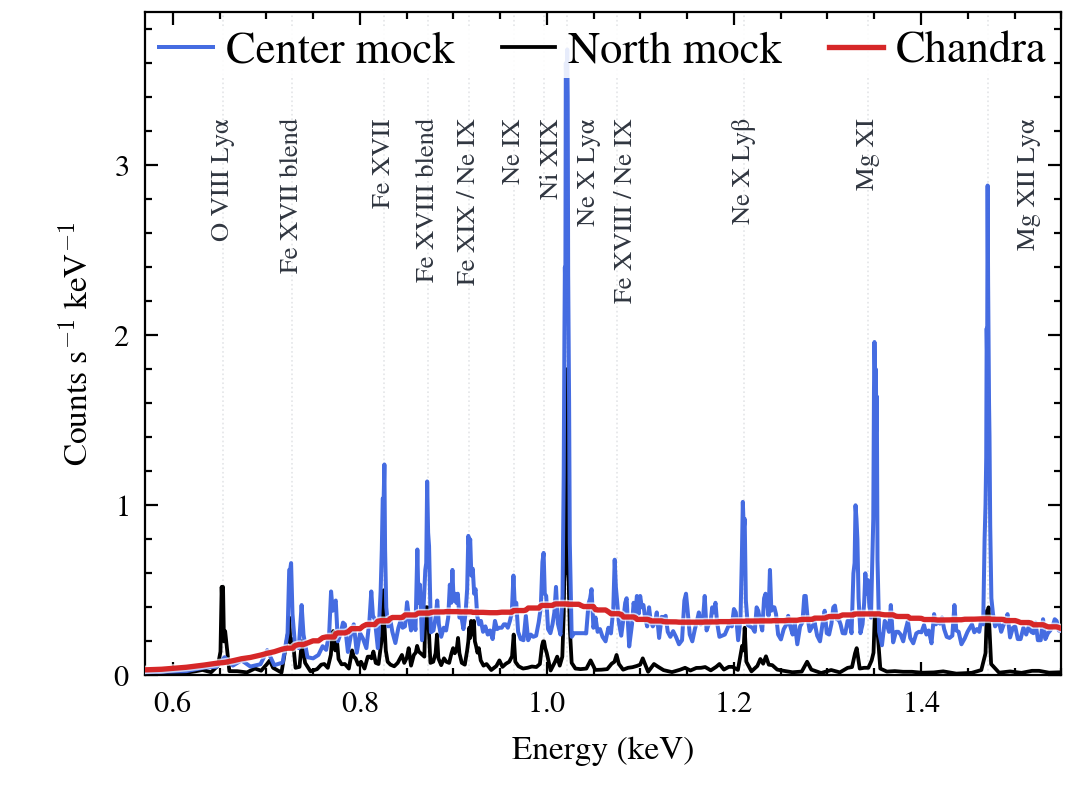
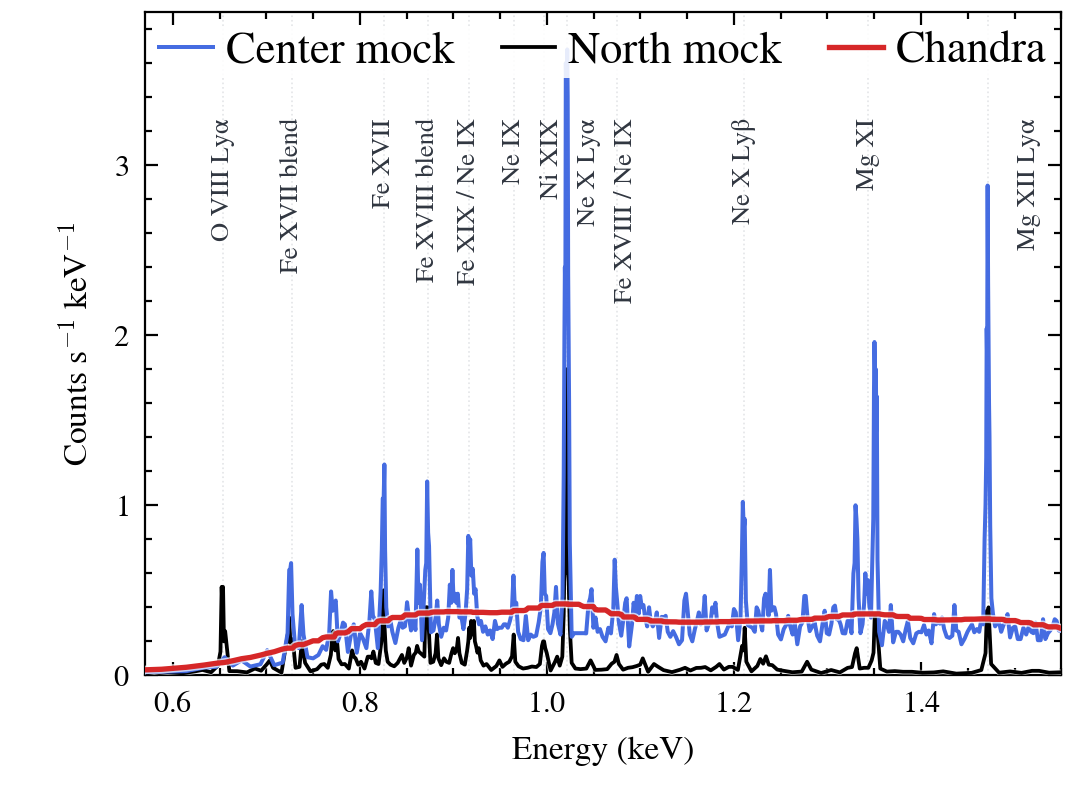
This is the labeled three-line comparison V2 of the Center and North regions, and does not replace any figure, slider, or download above; the V1 regional labeled version (eight wavelength text labels placed over the data panel) remains in the bundle but is intentionally superseded. The blue (royalblue) curve is the 50 ks seeded min30 Poisson connected mock data for Center (40″×80″) on its native grouped display grid (464 display bins); the black curve is an independently seeded 50 ks min30 Poisson connected mock data for North (80″×80″) on its distinct native grouped display grid (101 display bins). Both curves are data realizations, not models, and have no error bars or interpolation. The red curve is a Center-only eight-epoch Chandra-RMF control: each epoch source is first folded through its own Chandra RMF at fixed SQUDE ARF, then exposure-weighted, and finally conservatively projected to the Center min30 display grid; it is not a Chandra-data spectrum and contains no area, peak, or integral renormalization. Center and North have different apertures, so curve heights are not same-area surface brightness. V2 places 25 AtomDB/SQUDE keV-only grouped reference guides in a separate top annotation band above the data panel — all label text uses keV to match the x axis, and these are not independent detections or unique deblended fit assignments. This figure is not evidence for fit quality, physical parameters, or individual line identifications.
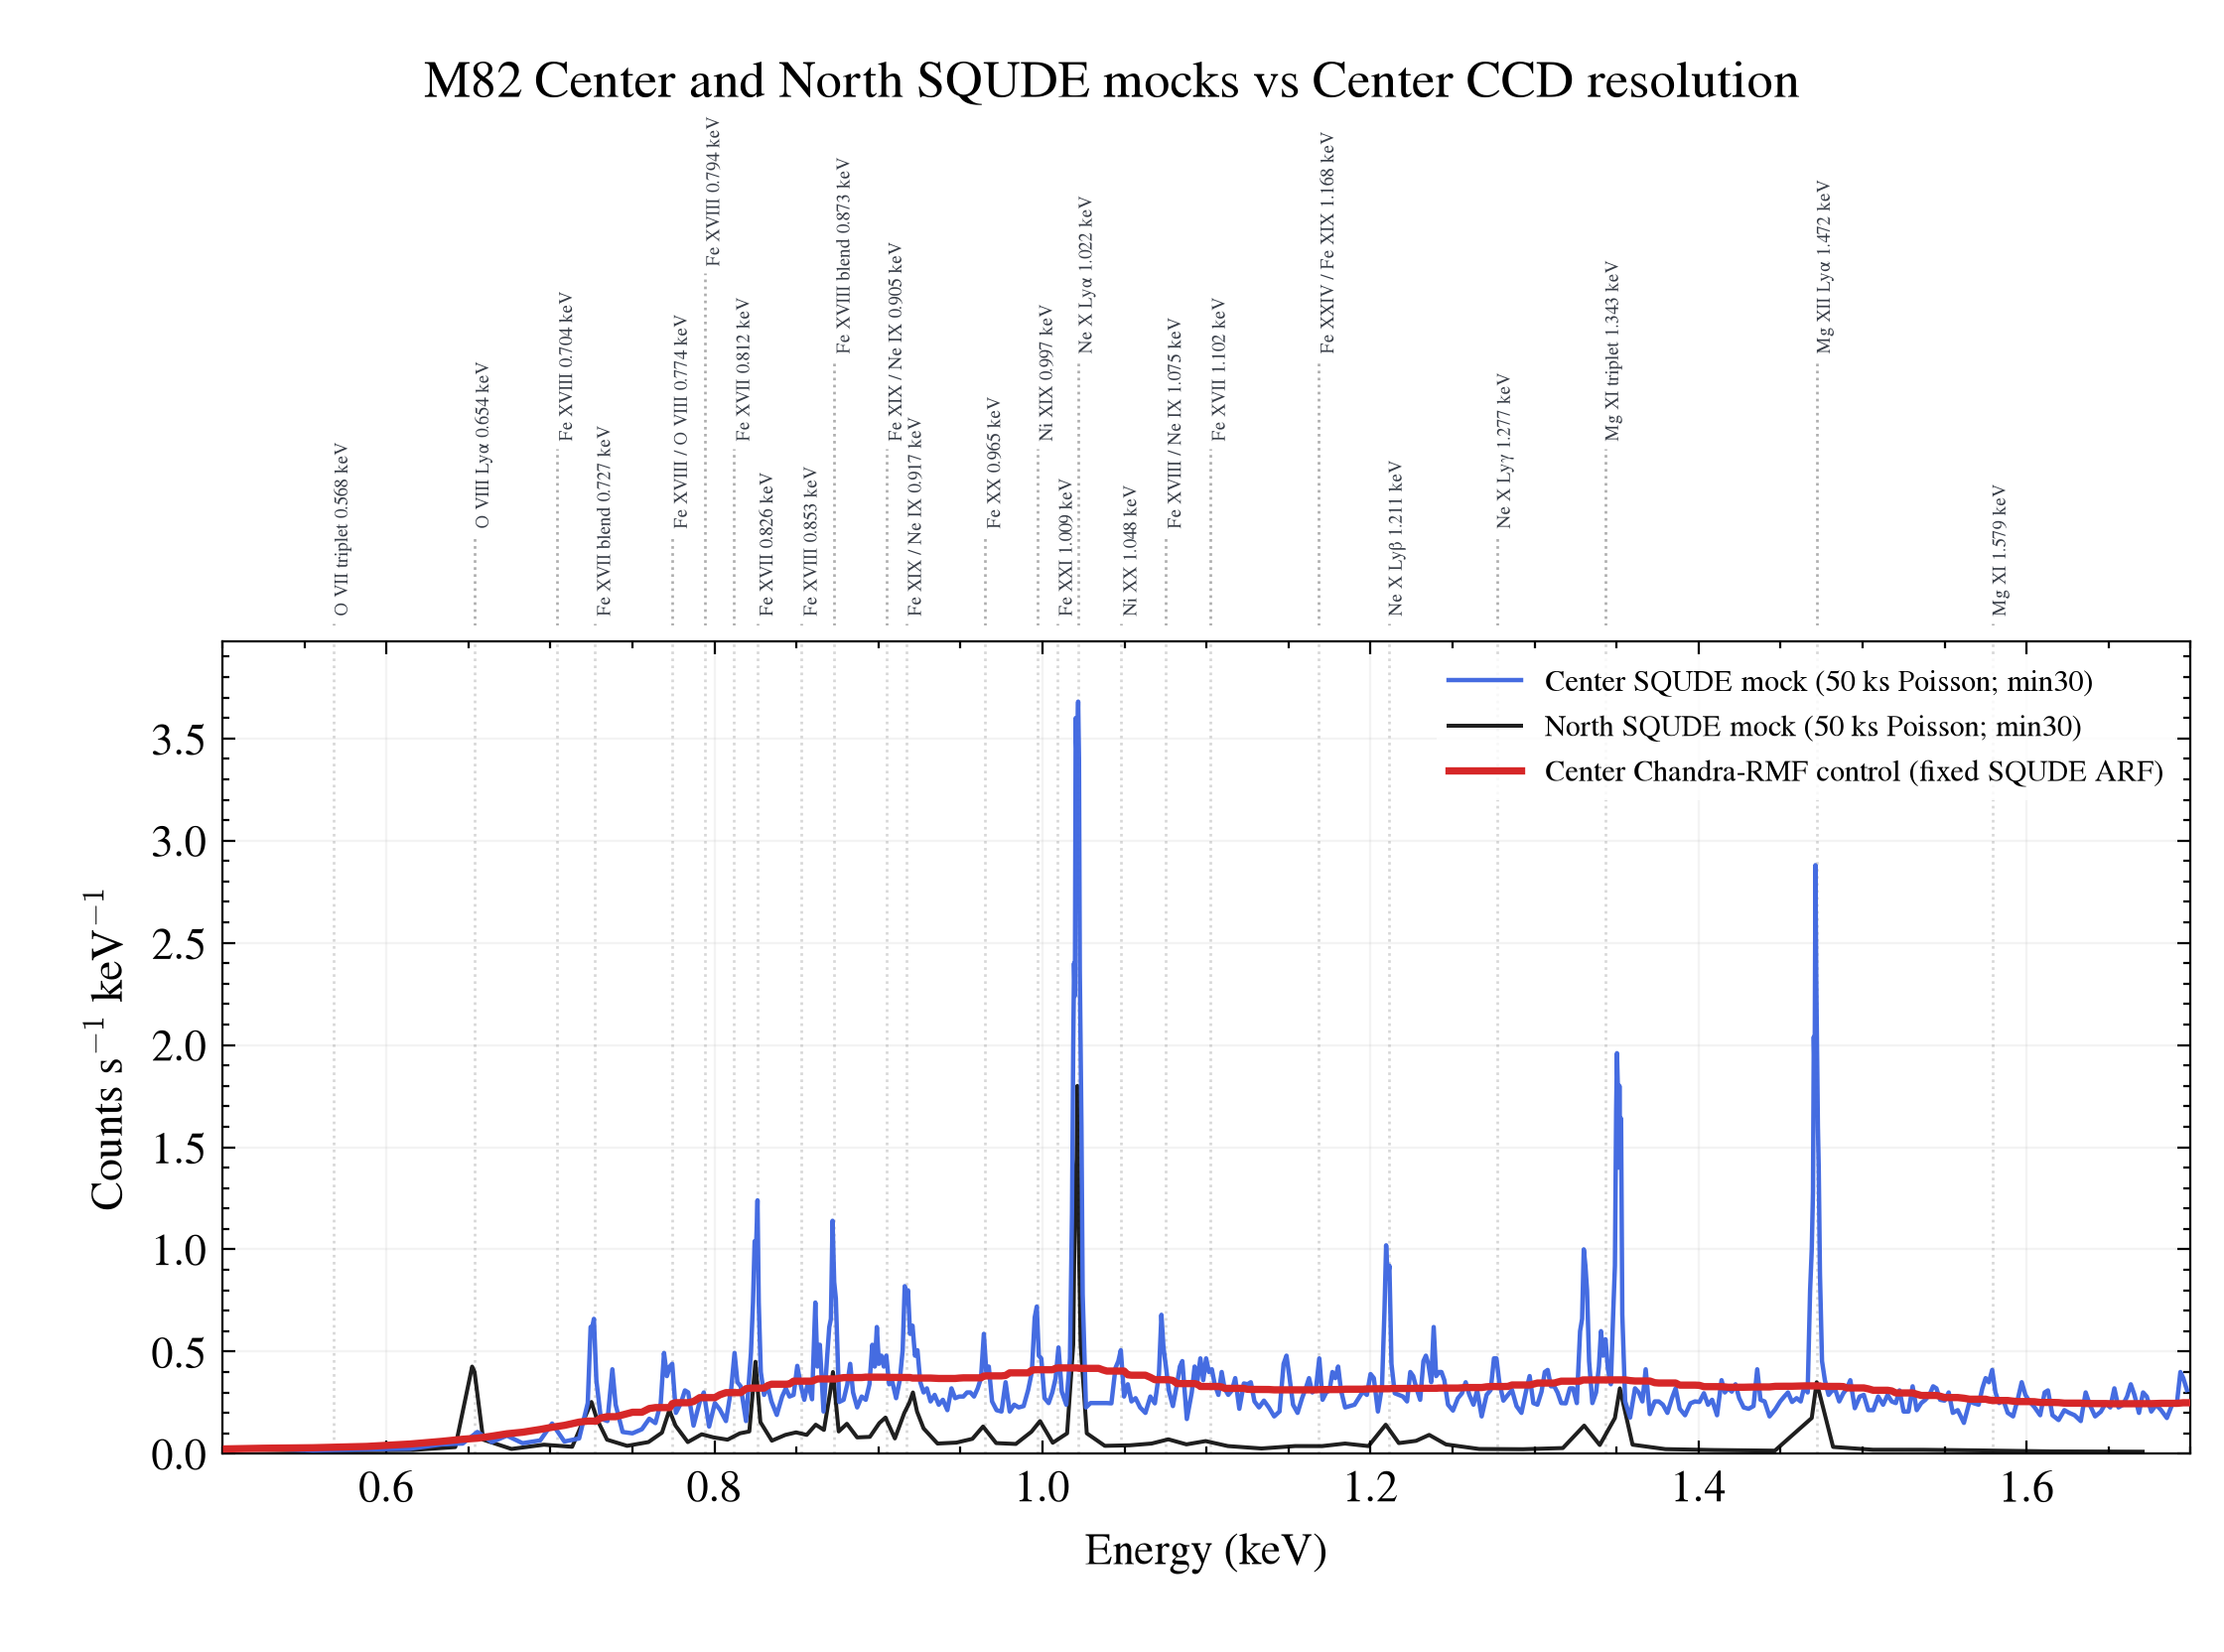
V2 regional labeled 1-columnV2 regional labeled 2-columnDownload V2 regional labeled manifestDownload V2 regional labeled producerDownload shared AtomDB bounded-evidence JSON
4G. Grouping-sensitivity slider: Center/North min30 versus min20 interactive comparison
This is the grouping-sensitivity interactive slider for the Center and North regions, and does not replace any figure or download above. Both sides use the identical seeded PHAs (Center seed 2026071902, North seed 2026071901), the same 25 AtomDB/SQUDE keV-only grouped reference guides, colors and legend roles, energy range, and y-axis semantics. The left side shows min20 (group_counts 20): Center 653 display bins, North 145 display bins; the right side shows min30 (group_counts 30): Center 464 display bins, North 101 display bins. The red curve is the Center-only eight-epoch fold-before-weight Chandra-RMF control at fixed SQUDE ARF; both sides use the same Center source and epoch-specific RMFs, conservatively rebinned to the distinct min20/min30 display grids. Grouping changes the display layer only; each variant retains its native grid and absolute counts s⁻¹ keV⁻¹, with no interpolation, smoothing, or renormalization. Center and North have different apertures, so heights are not same-area surface brightness. This figure is not evidence for fit quality, physical parameters, or individual line identifications.
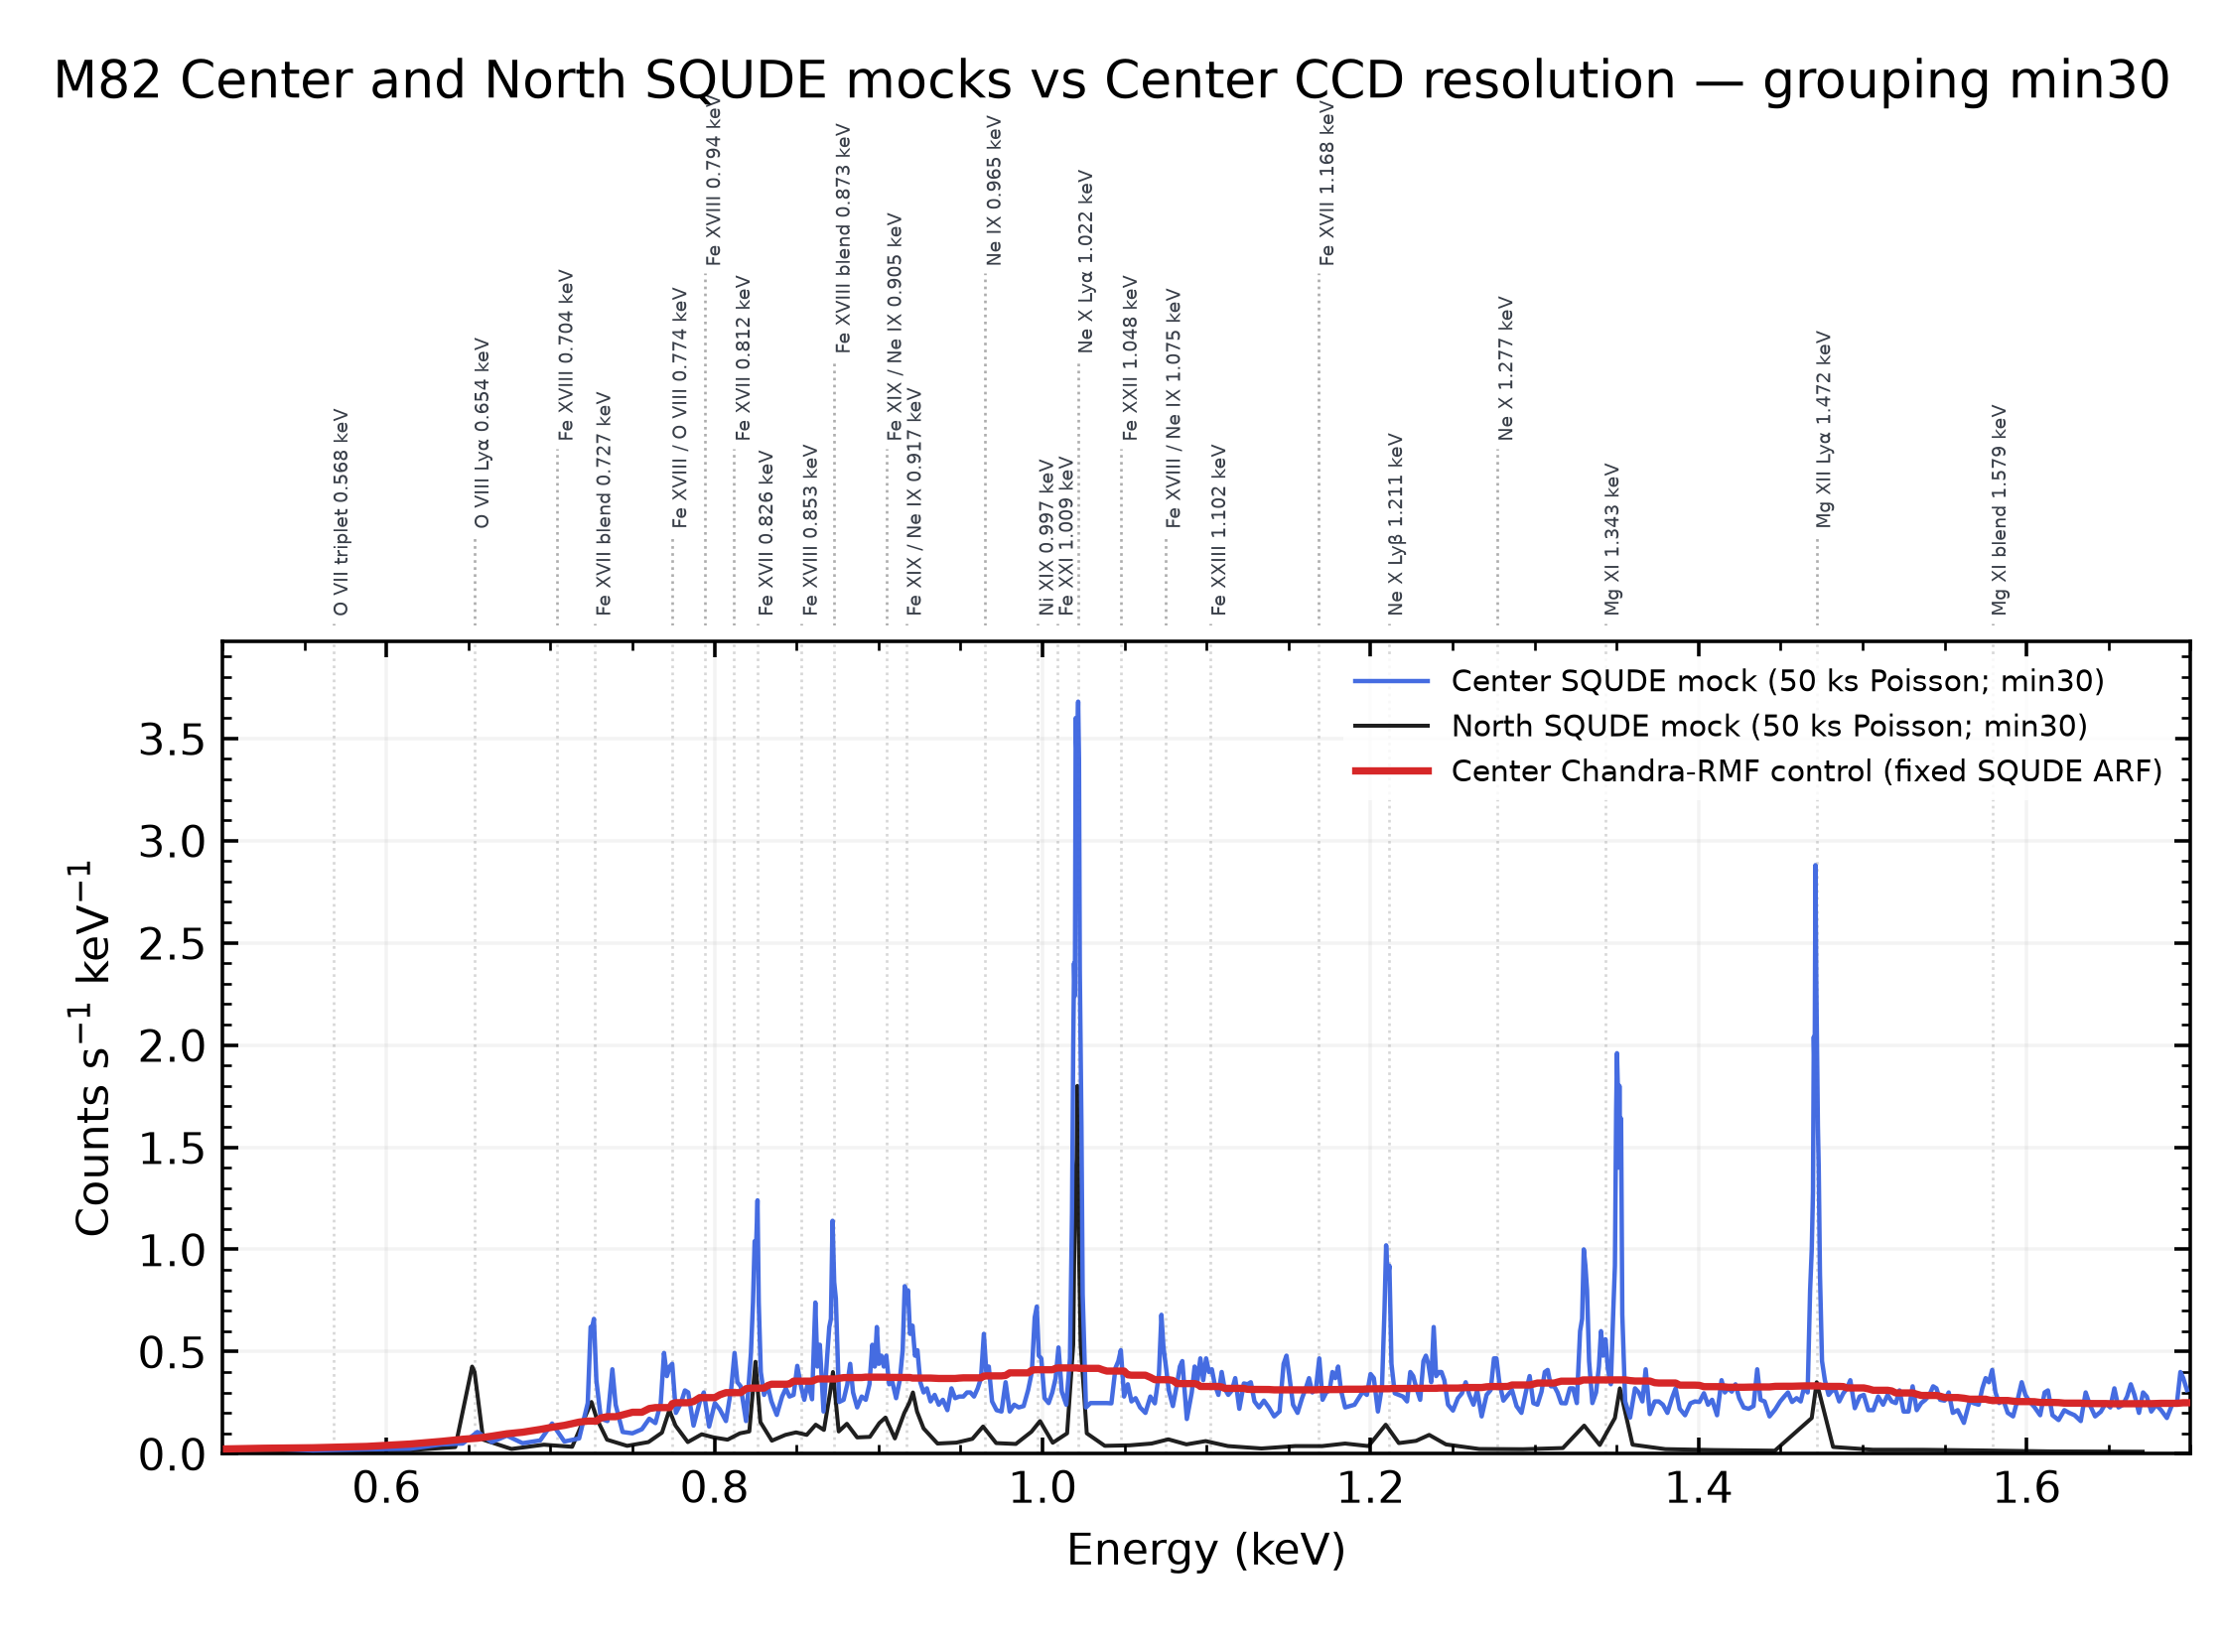 min20 · 20 counts/binmin30 · 30 counts/bin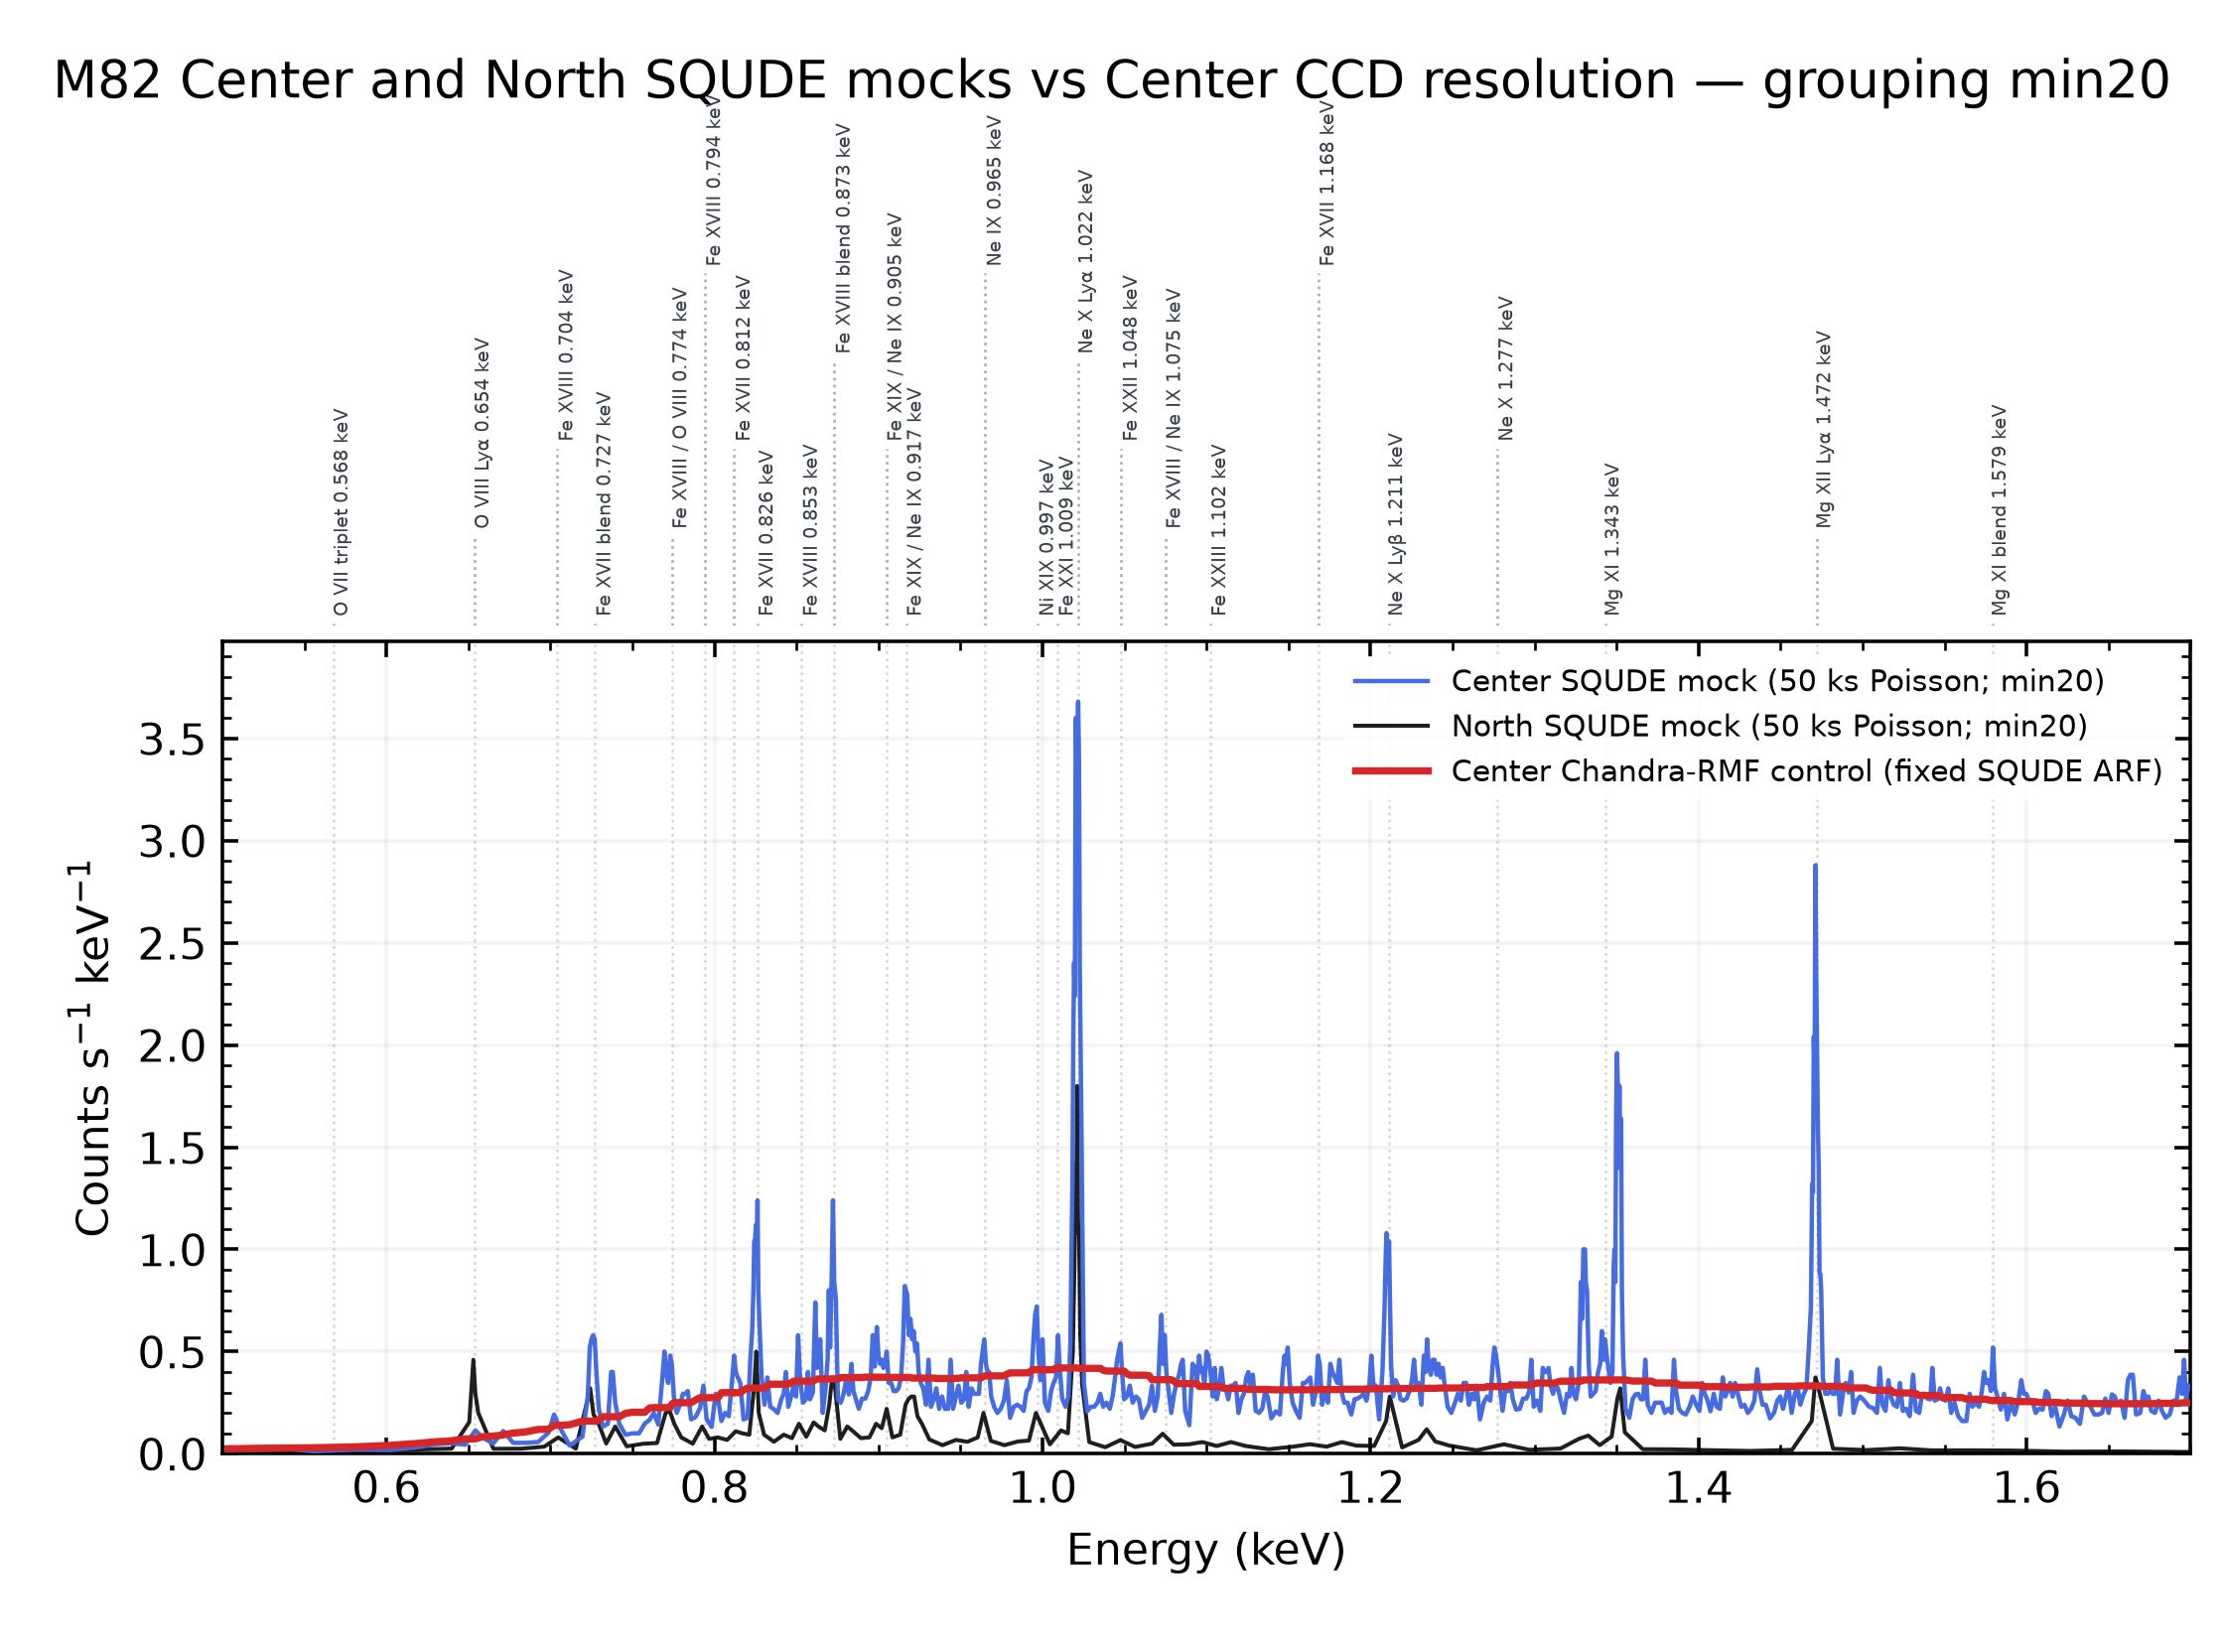
min20 1-columnmin20 2-columnmin30 1-columnmin30 2-columnDownload slider manifestDownload slider producer
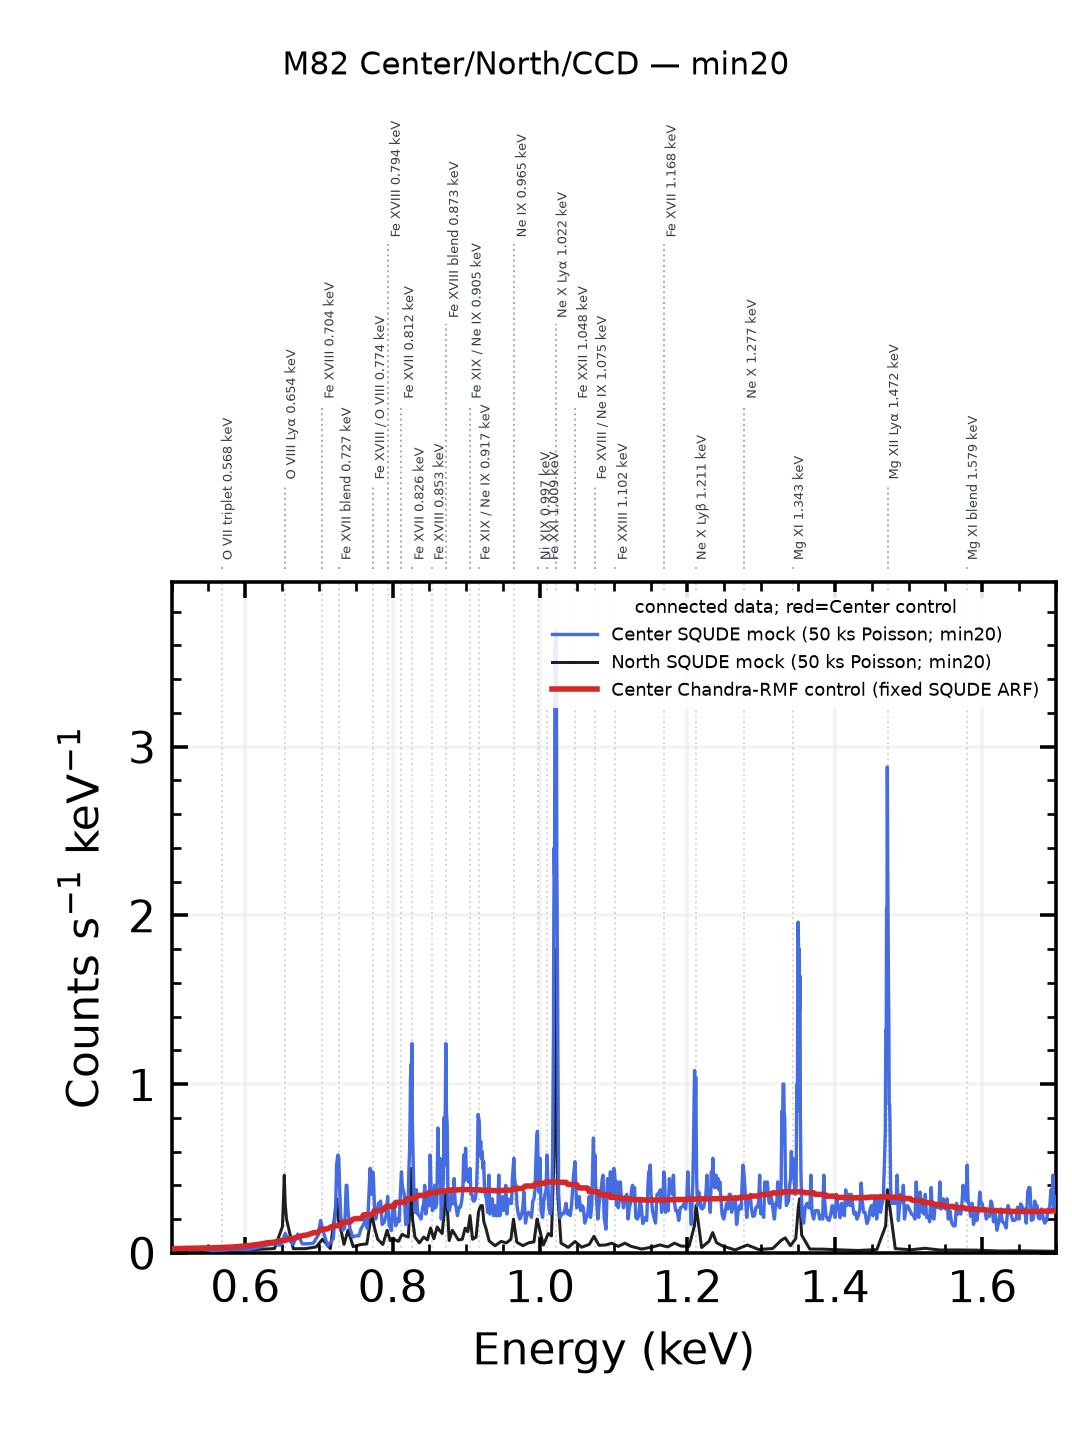
4H. Style-variant interactive comparison: Center min30 + North min10 three-way styleA/B/C switcher
This is the three-way style-variant interactive comparison for the Center min30 + North min10 seeded PHAs, and does not replace any figure, slider, or download above. All three style variants use the identical seeded PHAs (Center seed 2026071902 min30, North seed 2026071901 min10), the same energy range, grouping, and y-axis semantics. Style A = plain lines only (blue Center, black North, red Chandra-RMF control); Style B = Style A plus a white Chandra white halo behind the red control curve; Style C = Style B plus a white halo behind the North curve as well. Grouping is unchanged across all three variants; each retains its native grid and absolute counts s⁻¹ keV⁻¹, with no interpolation, smoothing, or renormalization. Center and North have different apertures, so heights are not same-area surface brightness. This figure is not evidence for fit quality, physical parameters, or individual line identifications.
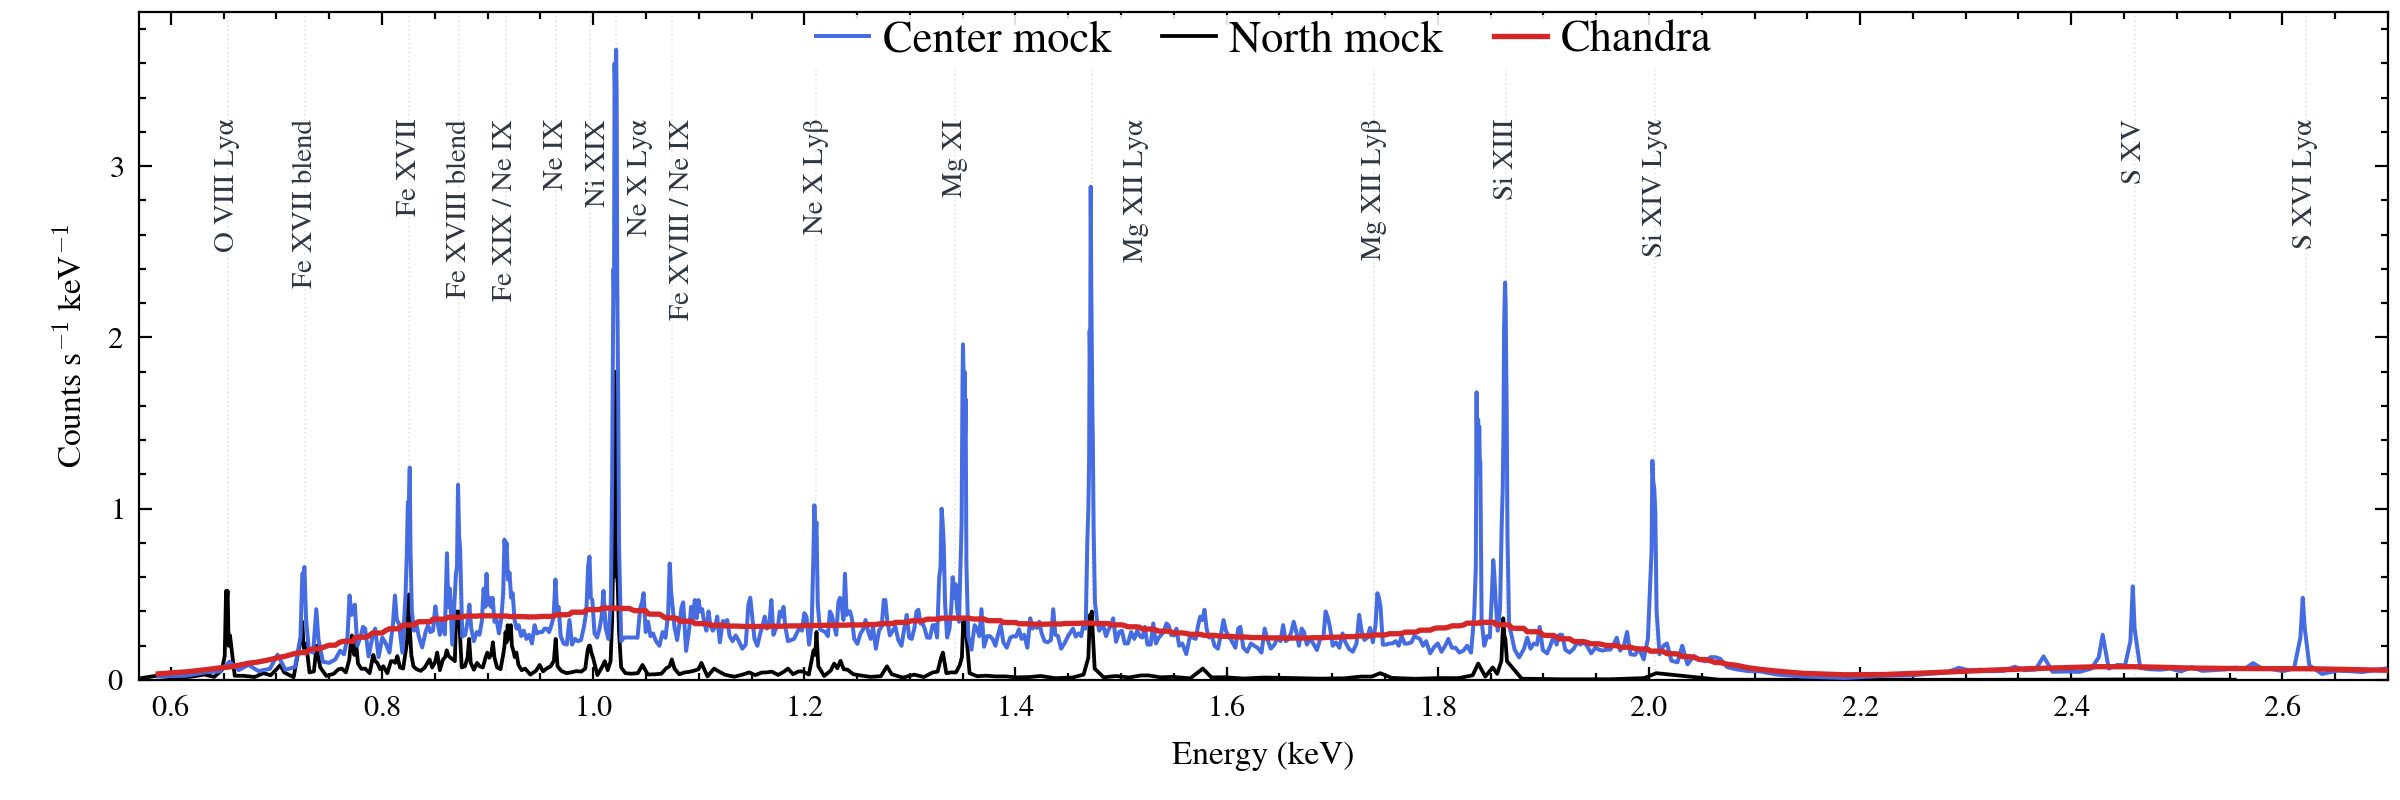
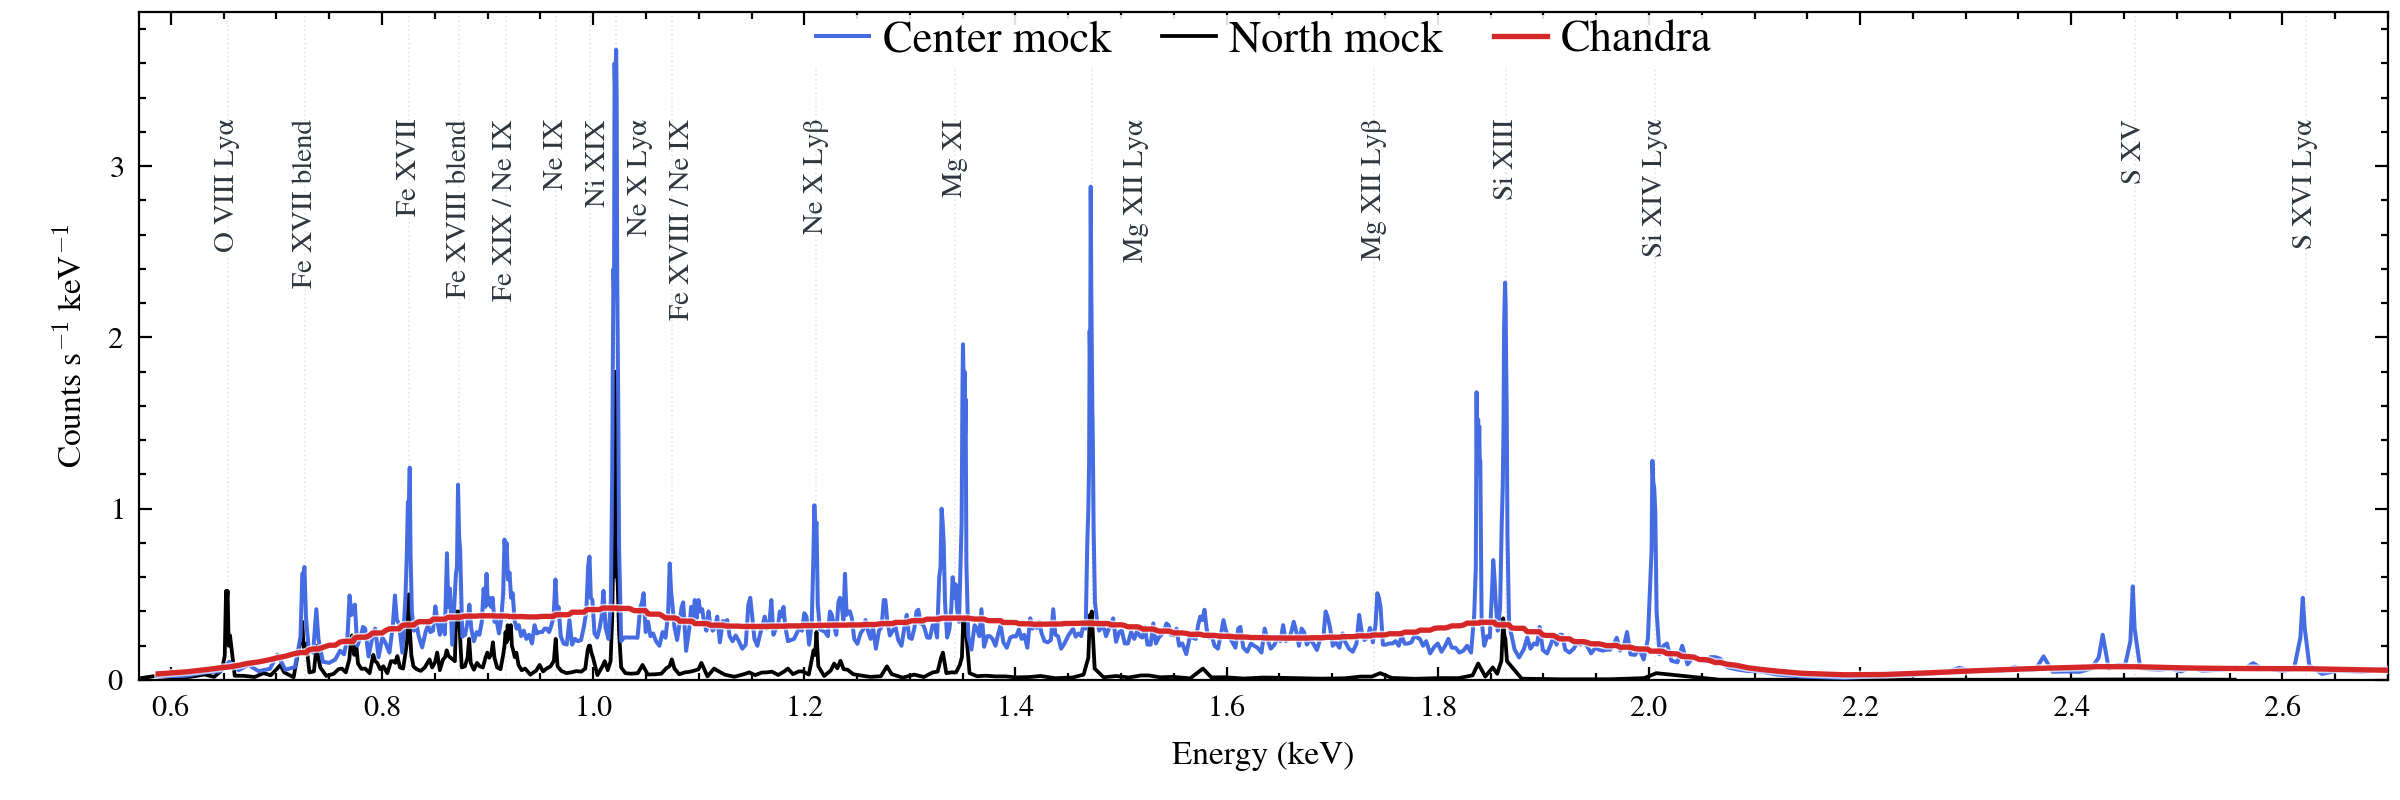
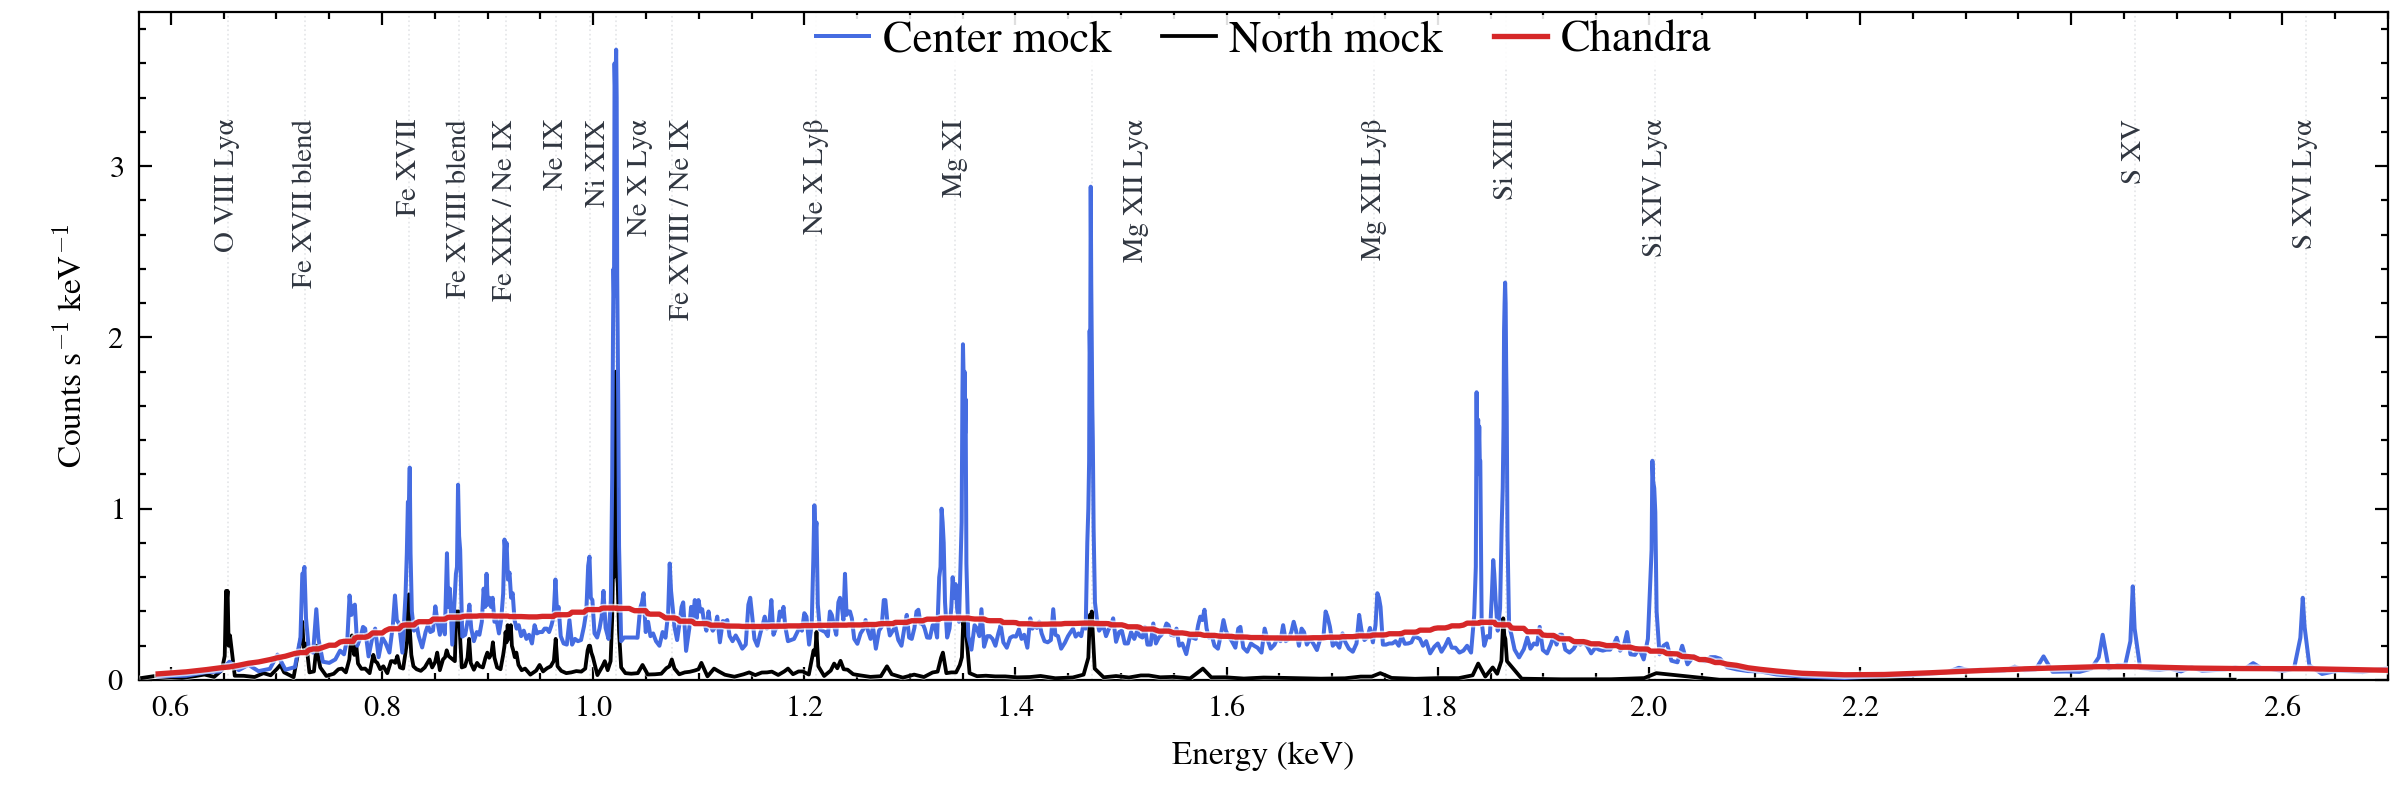
Style A: 1-column2-column Style B: 1-column2-column Style C: 1-column2-column
Three-region extension: North / Center / South
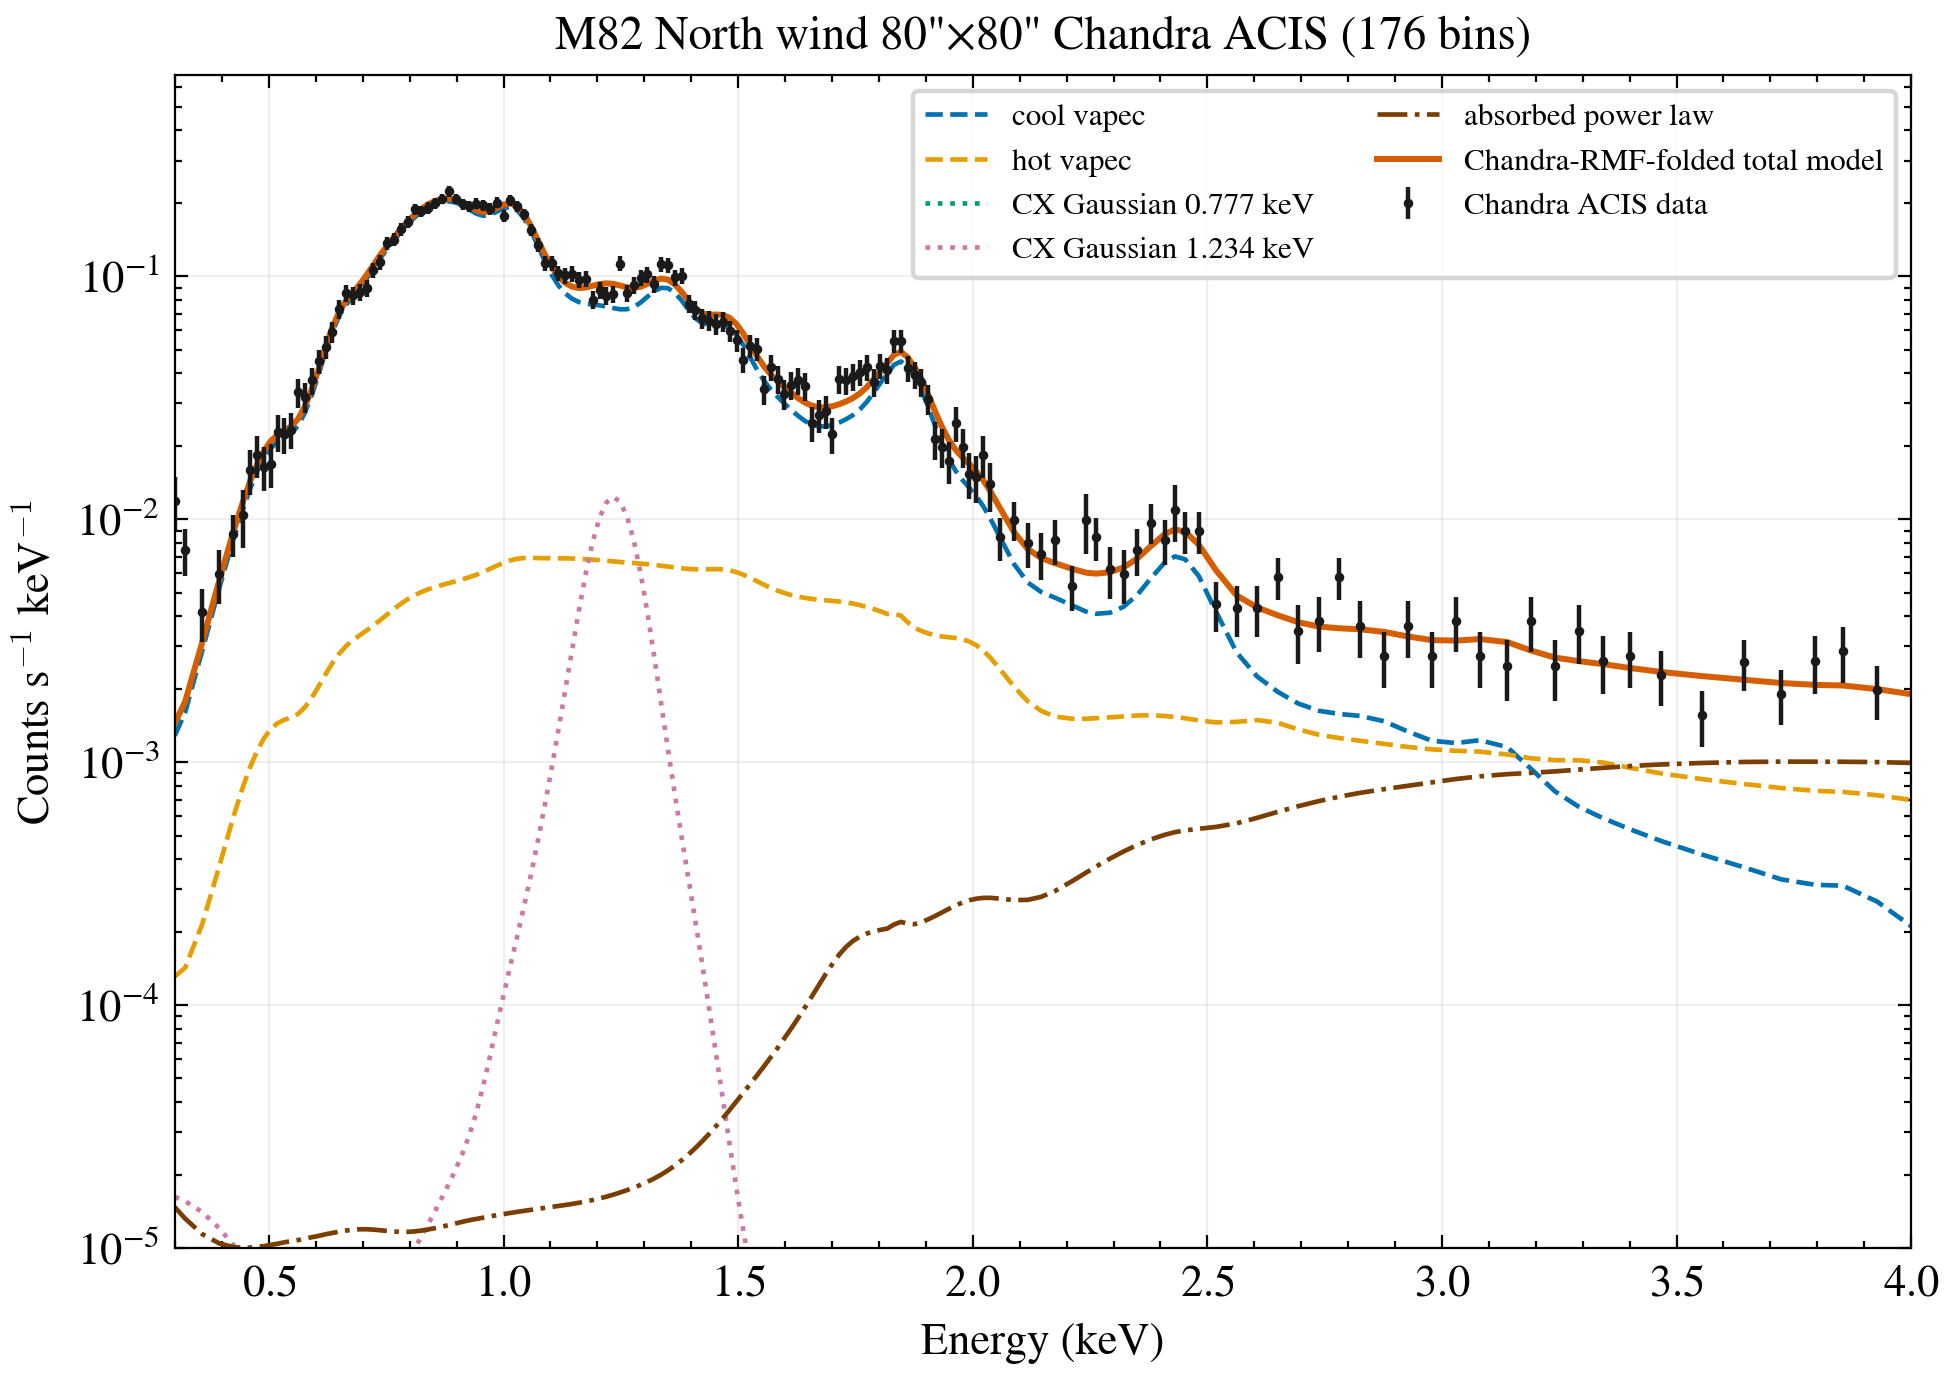
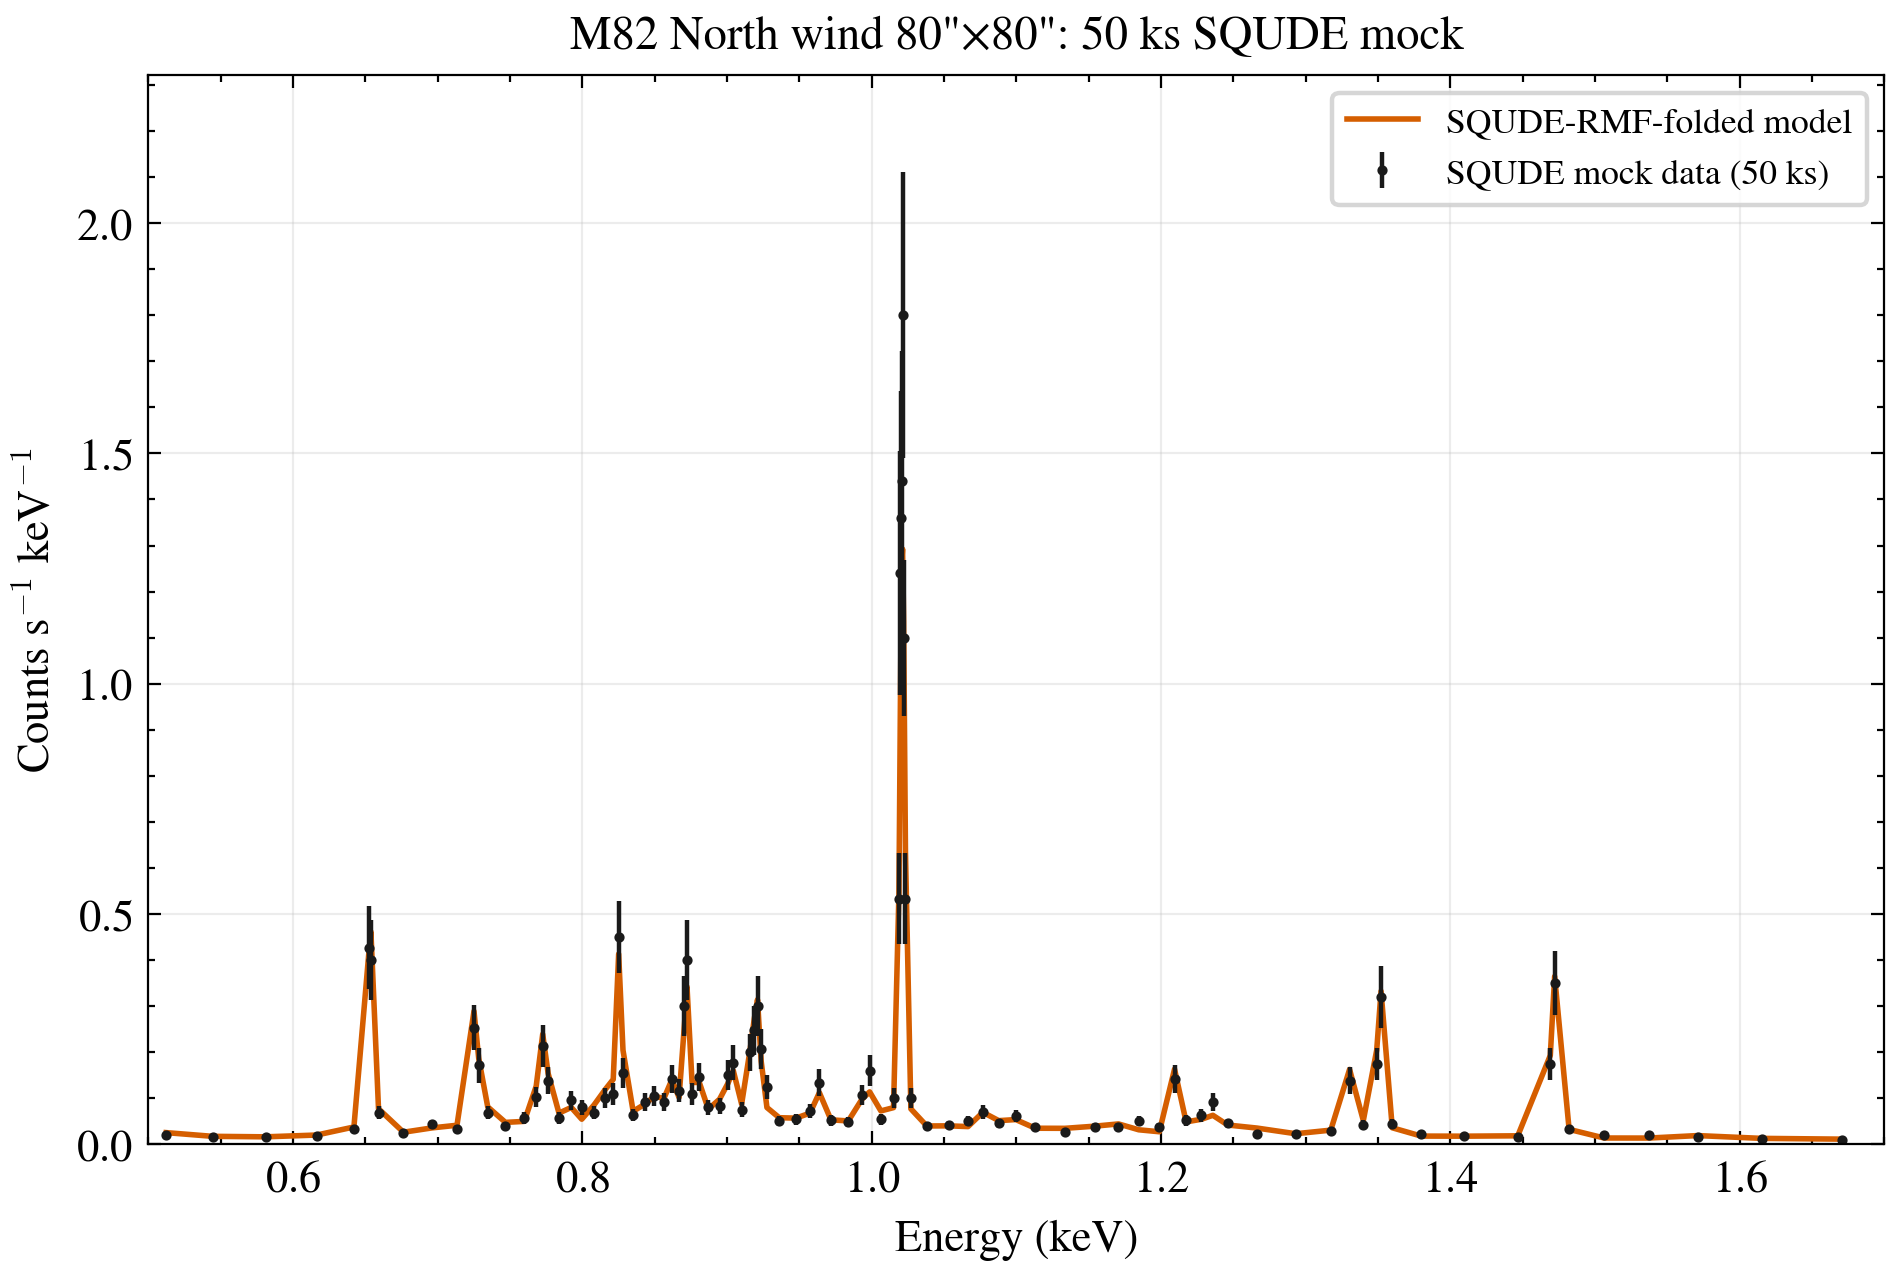
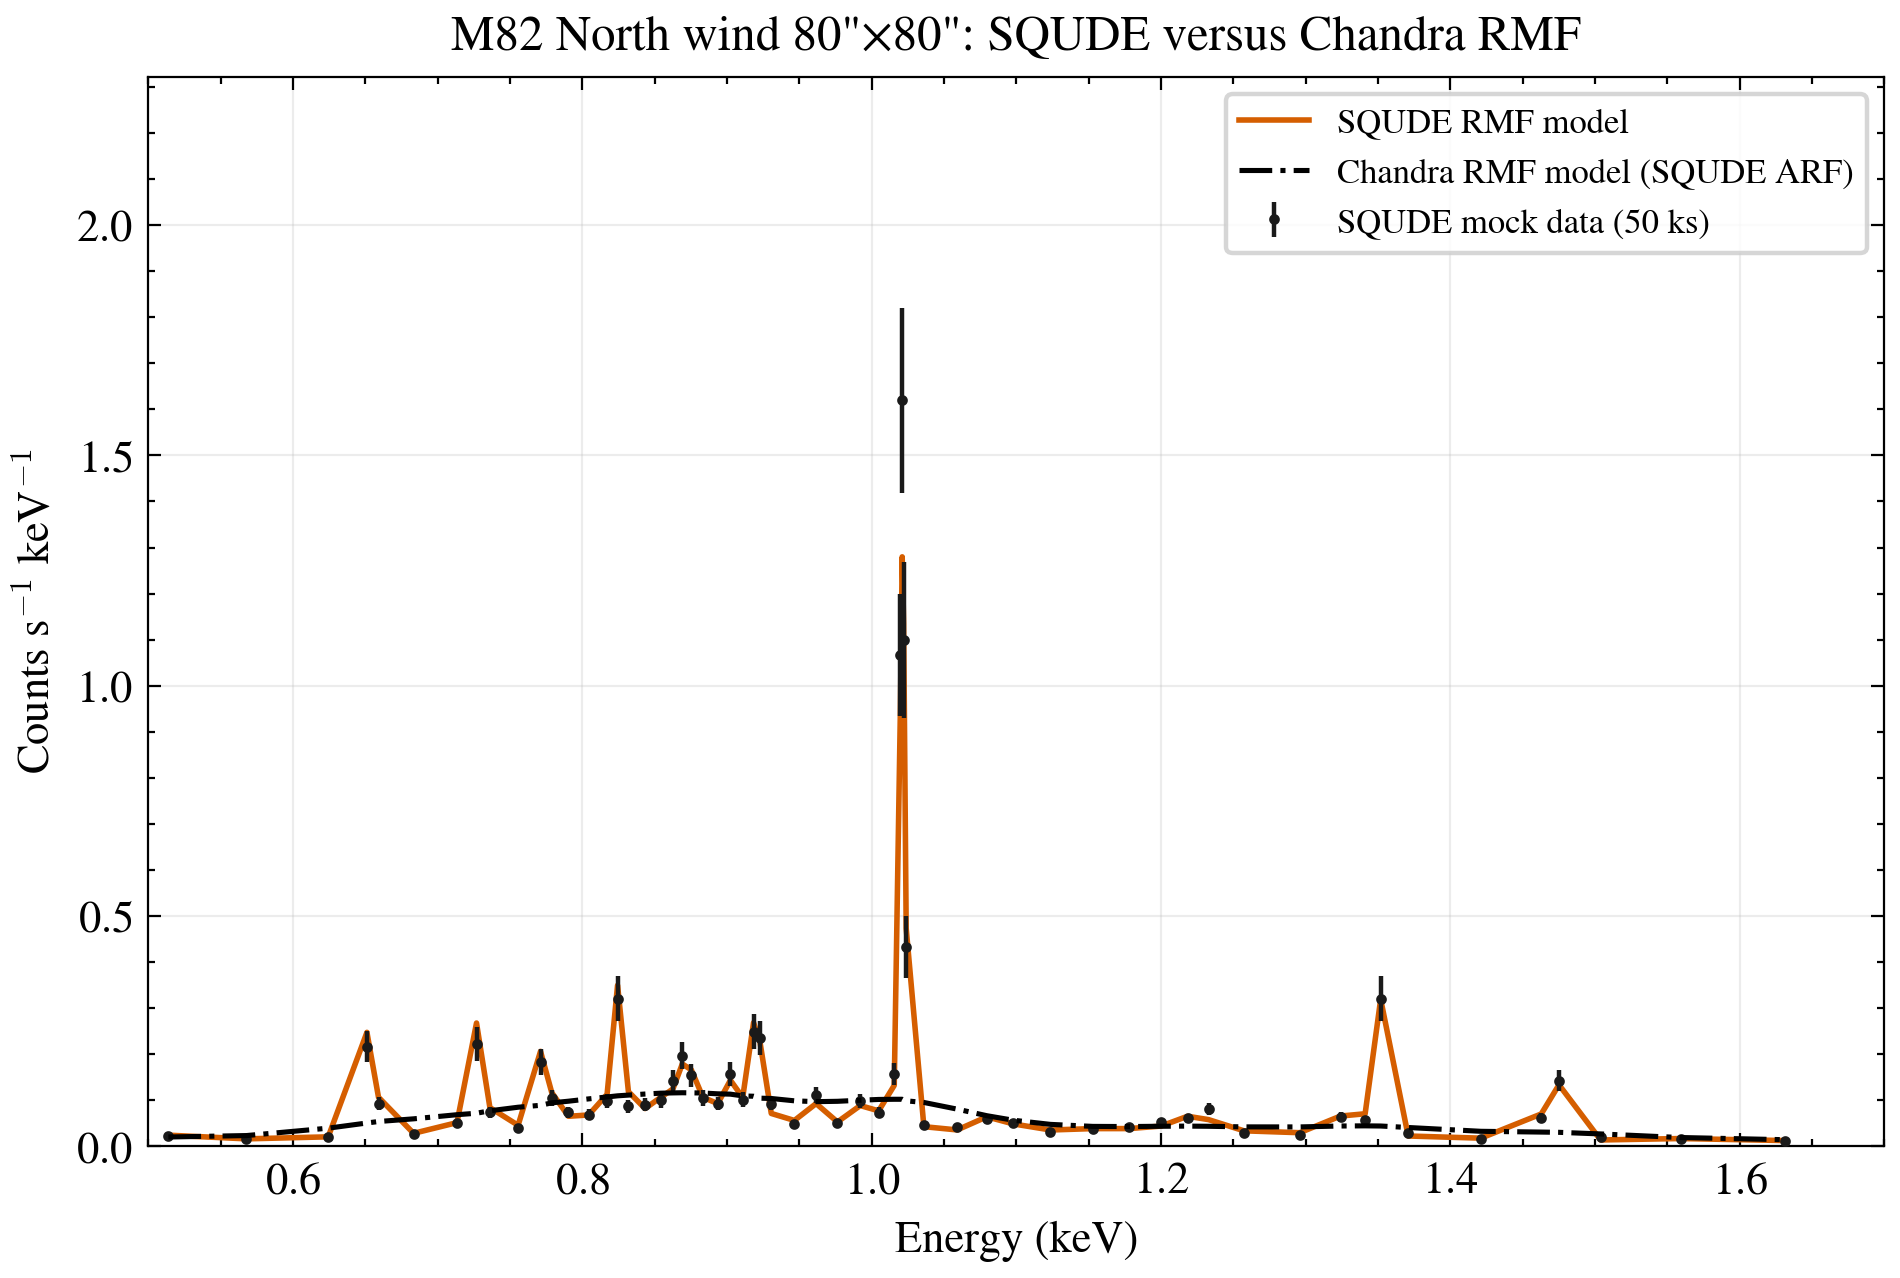
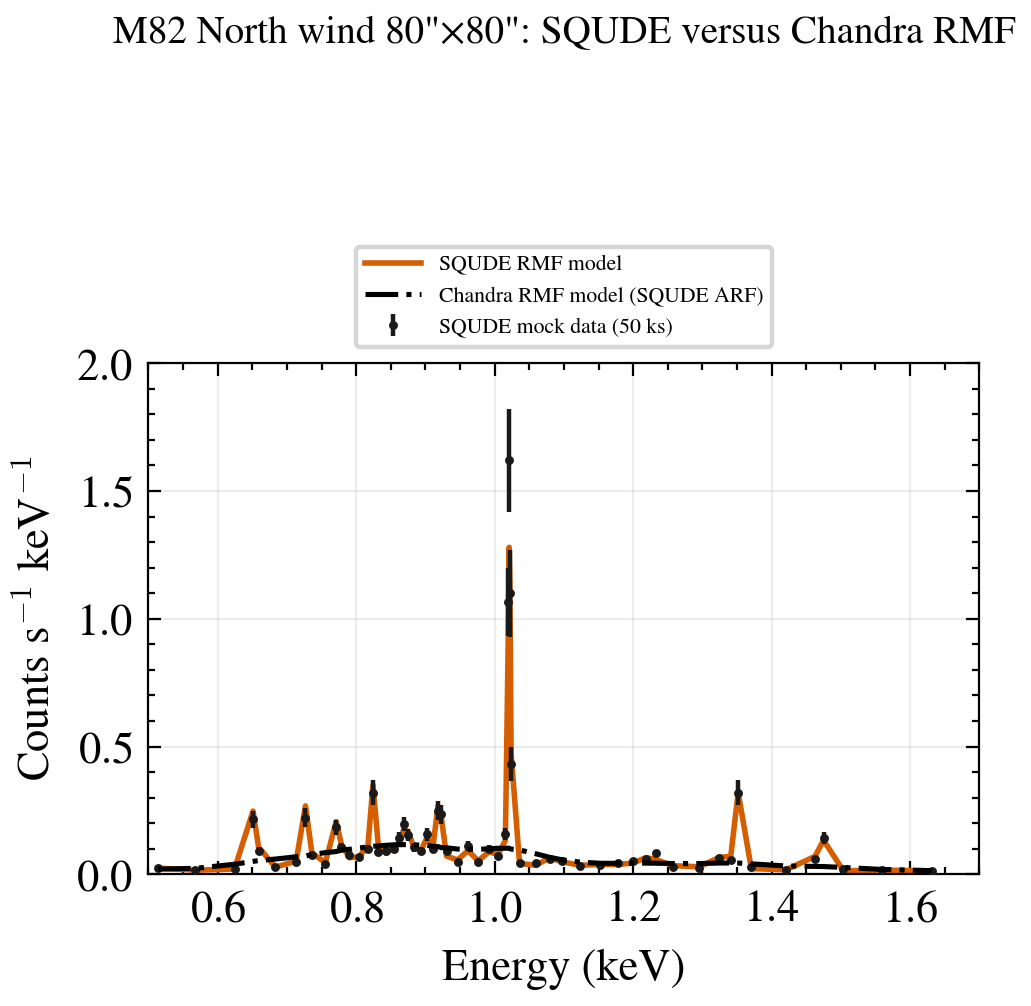
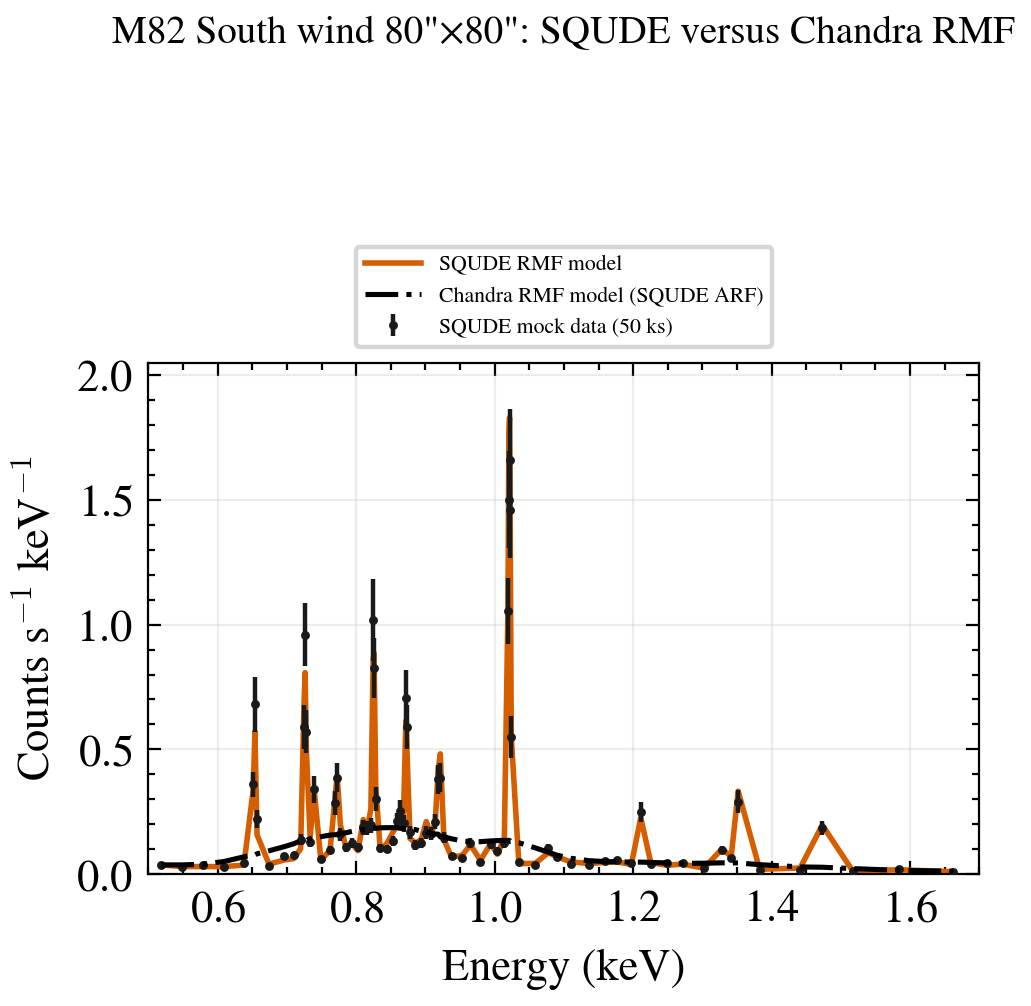
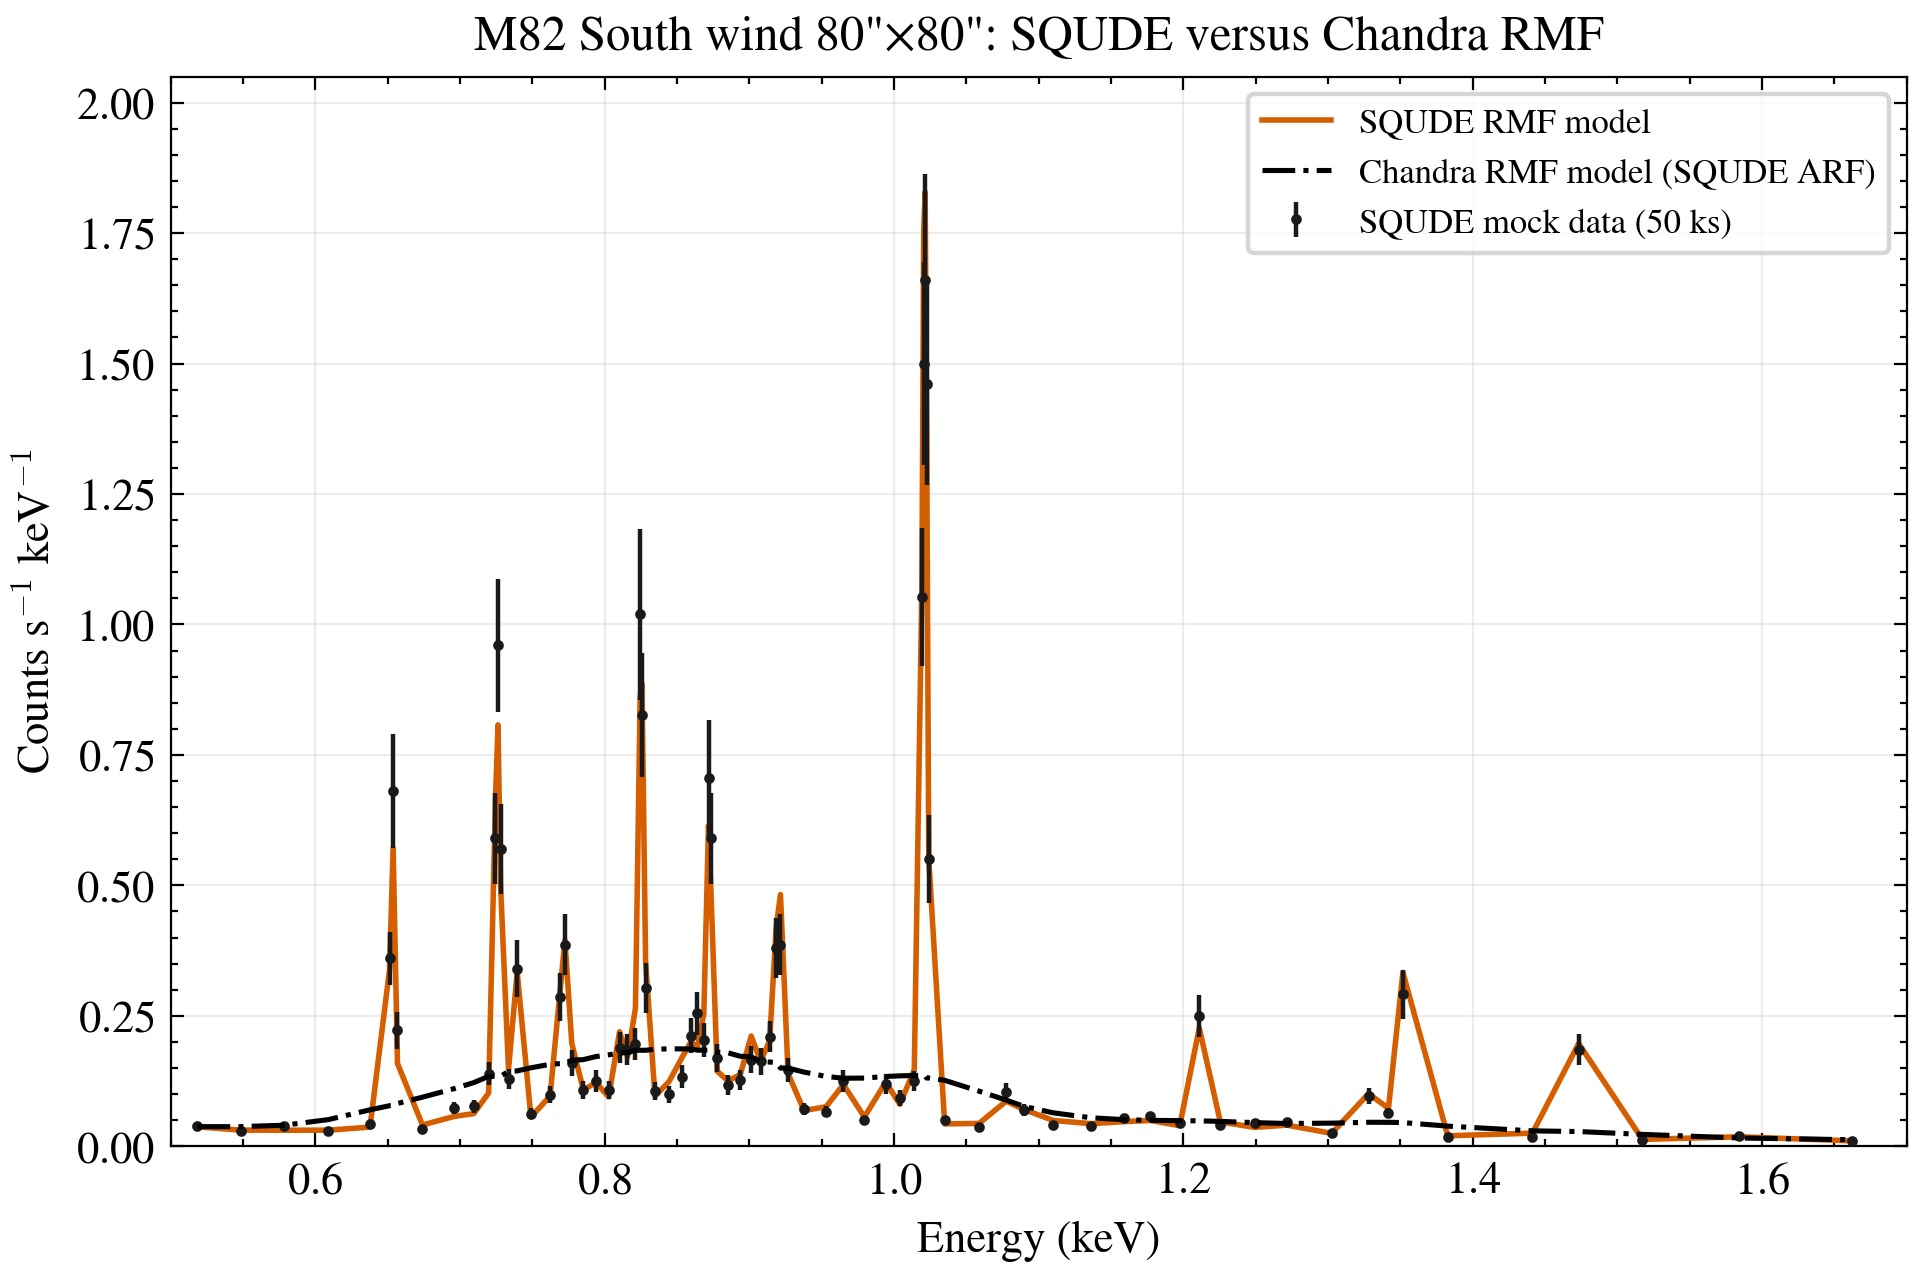
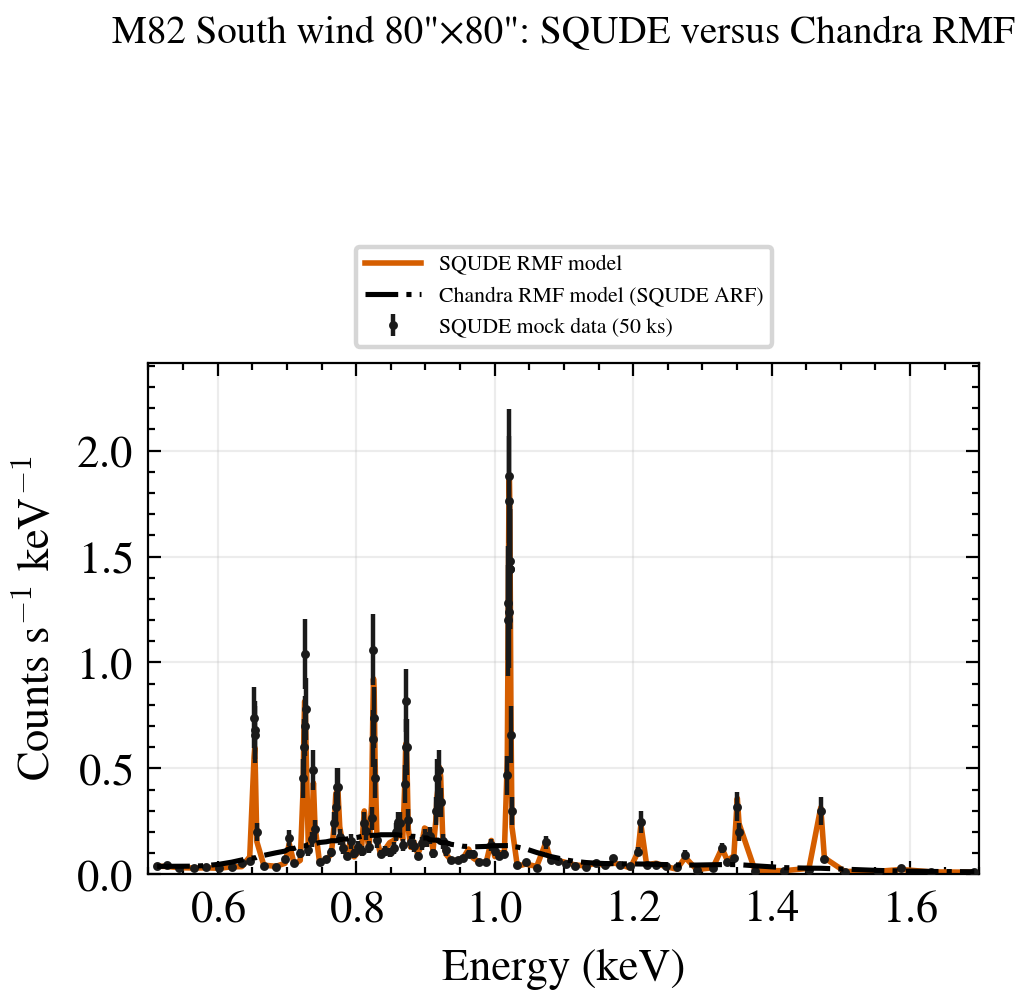
Each region uses its own Chandra PHA/ARF/RMF and has three scientifically separate figures. Figure A is real Chandra data plus response-folded total/components. Figure B is an independently seeded 50 ks SQUDE fake_pha plus its SQUDE-folded model. Figure C mirrors the full-aperture Figure 3: the same SQUDE mock, the SQUDE-RMF model, and a Chandra-RMF redistribution control at fixed SQUDE ARF. Figure C is not a Chandra-data spectrum. North/South retain the five original model components; Center uses the eight-epoch joint diffuse/CX-line-proxy/Fe-K plus epoch-variable XRB/ULX model. Every SQUDE panel retains the original min50 asset and adds a min30 version that changes display grouping only.
| Region | Chandra bins | baseline rstat | 0.3–4 keV thermal fraction | SQUDE raw counts / seed |
|---|---|---|---|---|
| North wind 80″×80″ | 176 | 1.096 | 95.8% | 3,636 / 2026071901 |
| Center starburst 40″×80″ | 459 | 1.200 joint | 58.5% | 27,040 / 2026071902 |
| South wind 80″×80″ | 154 | 1.199 | 87.8% | 4,916 / 2026071903 |
rstat=8.61). The replacement jointly fits all eight PHAs: diffuse VAPEC/CX-line-proxy/Fe-K parameters are shared, while each ObsID has an independent absorbed XRB/ULX normalization and effective absorption; the XRB slope is tied. The result is χ²_Gehrels/dof=2576.83/2147=1.200, Q=3.27×10⁻¹⁰, kT=0.709 keV, Γ_XRB=1.18, and an exposure-weighted 0.3–4 keV thermal fraction of 58.5%. The low Q means the formal null is still rejected: this is a substantially improved tutorial forward model, not a final physical fit. Broad-aperture point-source pile-up is not modeled separately and the legacy PHAs have no BACKFILE; a point-source-excised re-extraction remains preferred for diffuse-only inference.North wind · 80″×80″
Chandra 1-columnChandra 2-column
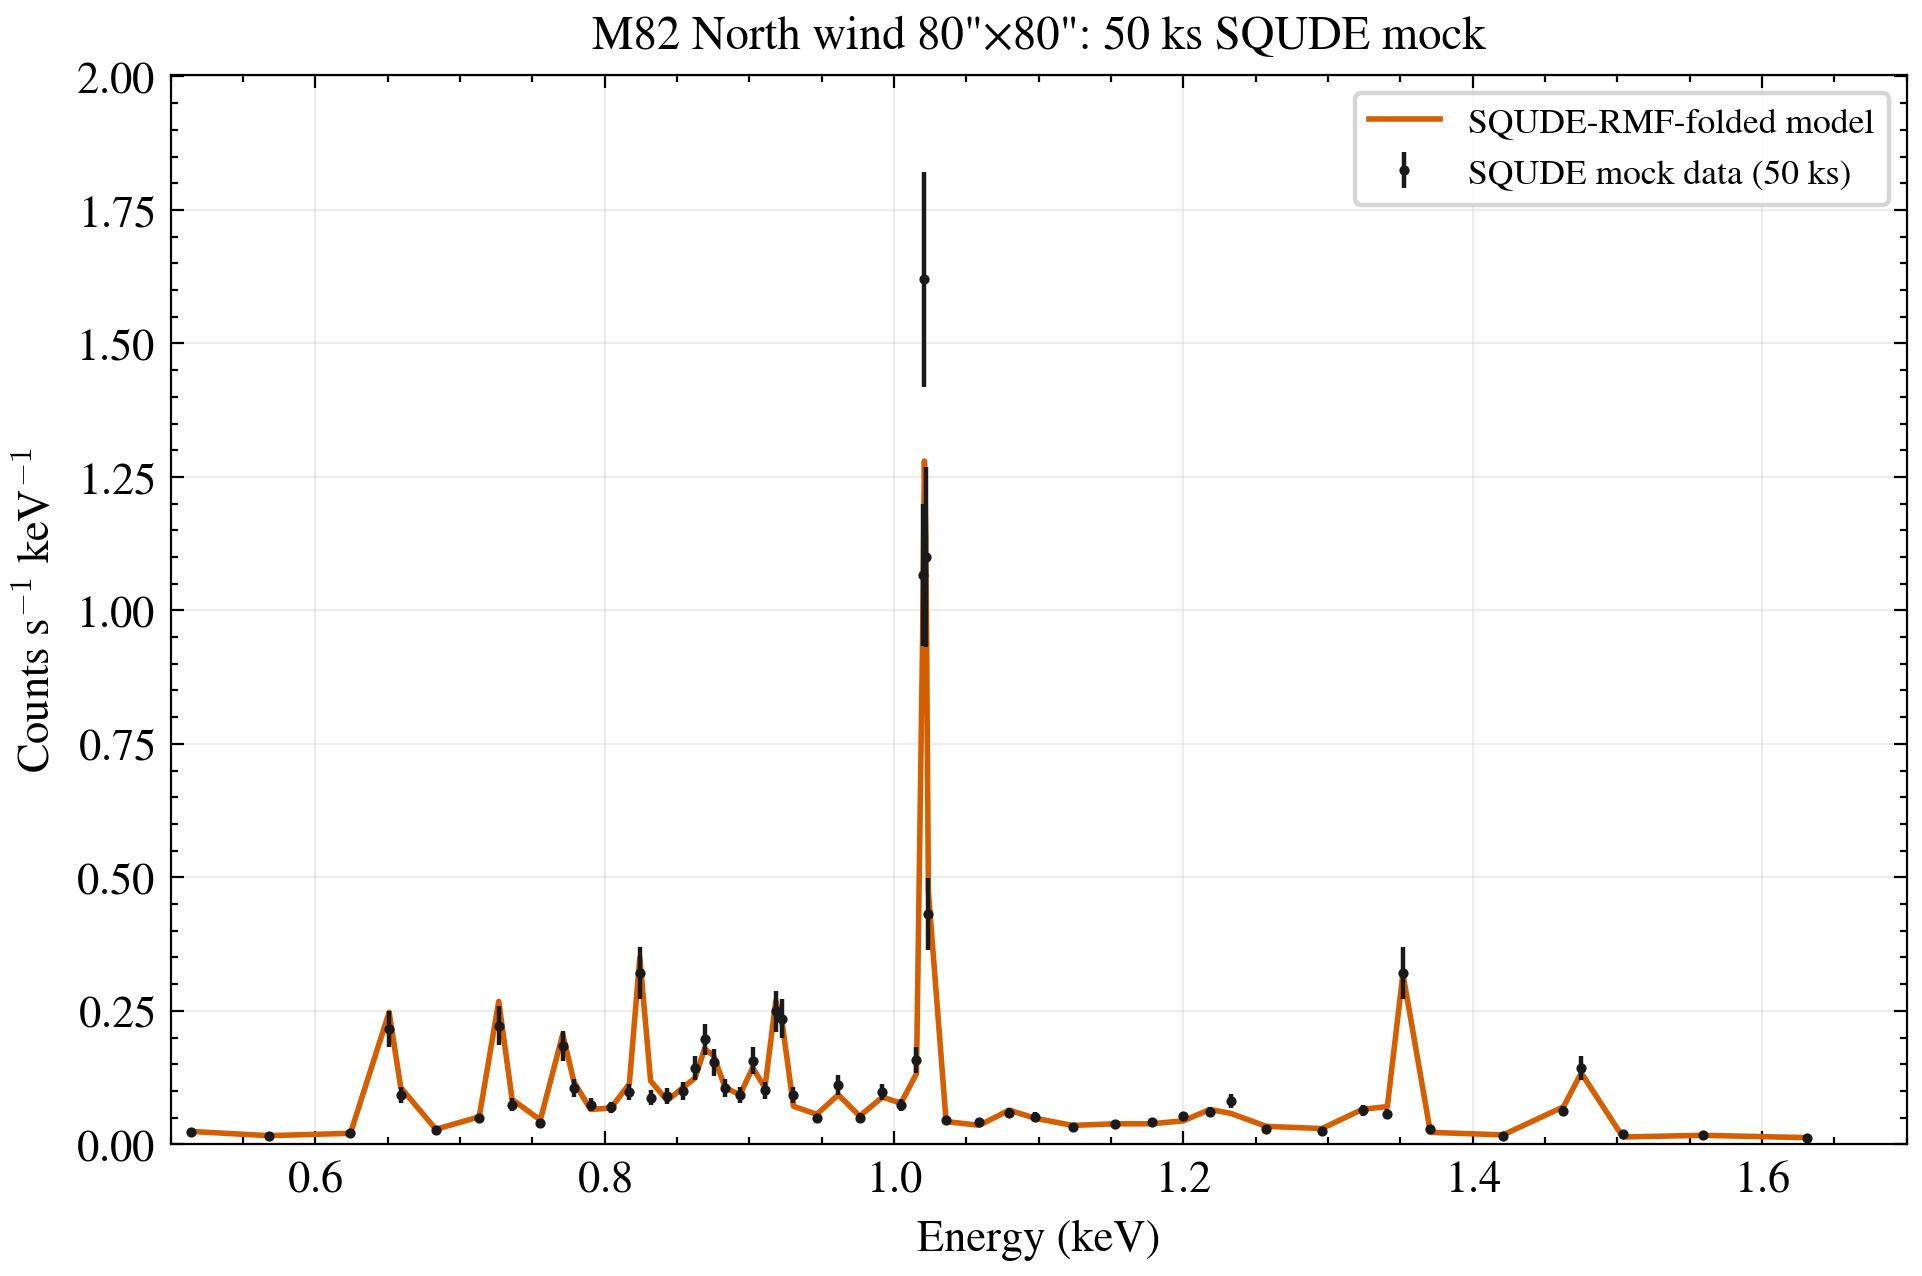
min50 1-columnmin50 2-columnmin30 1-columnmin30 2-column
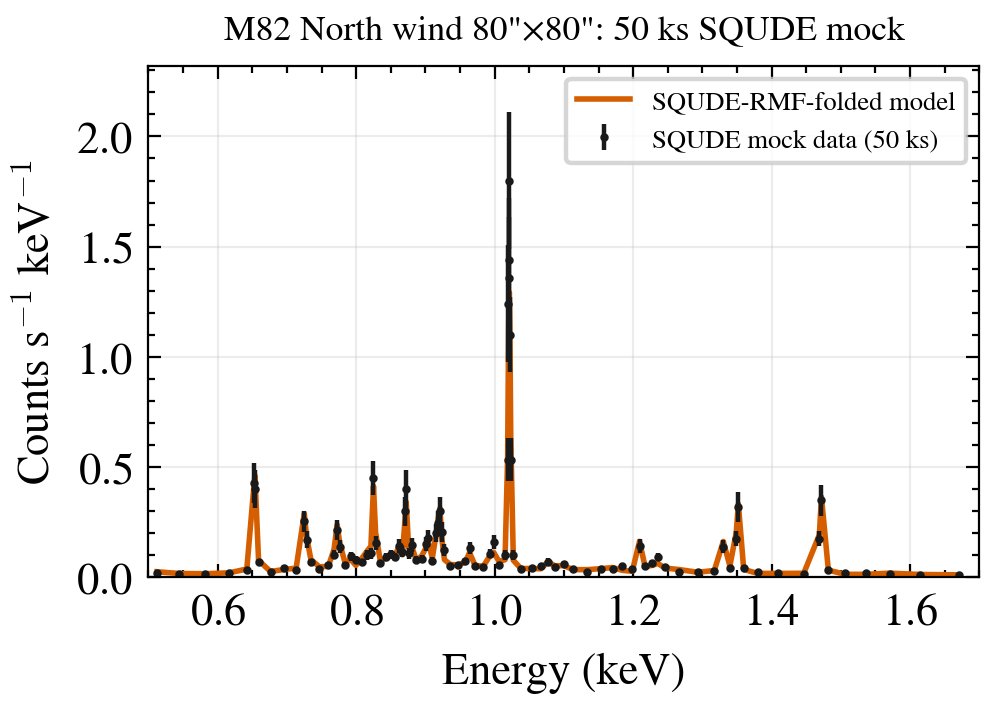
 min30 · 30 counts/binmin50 · 50 counts/bin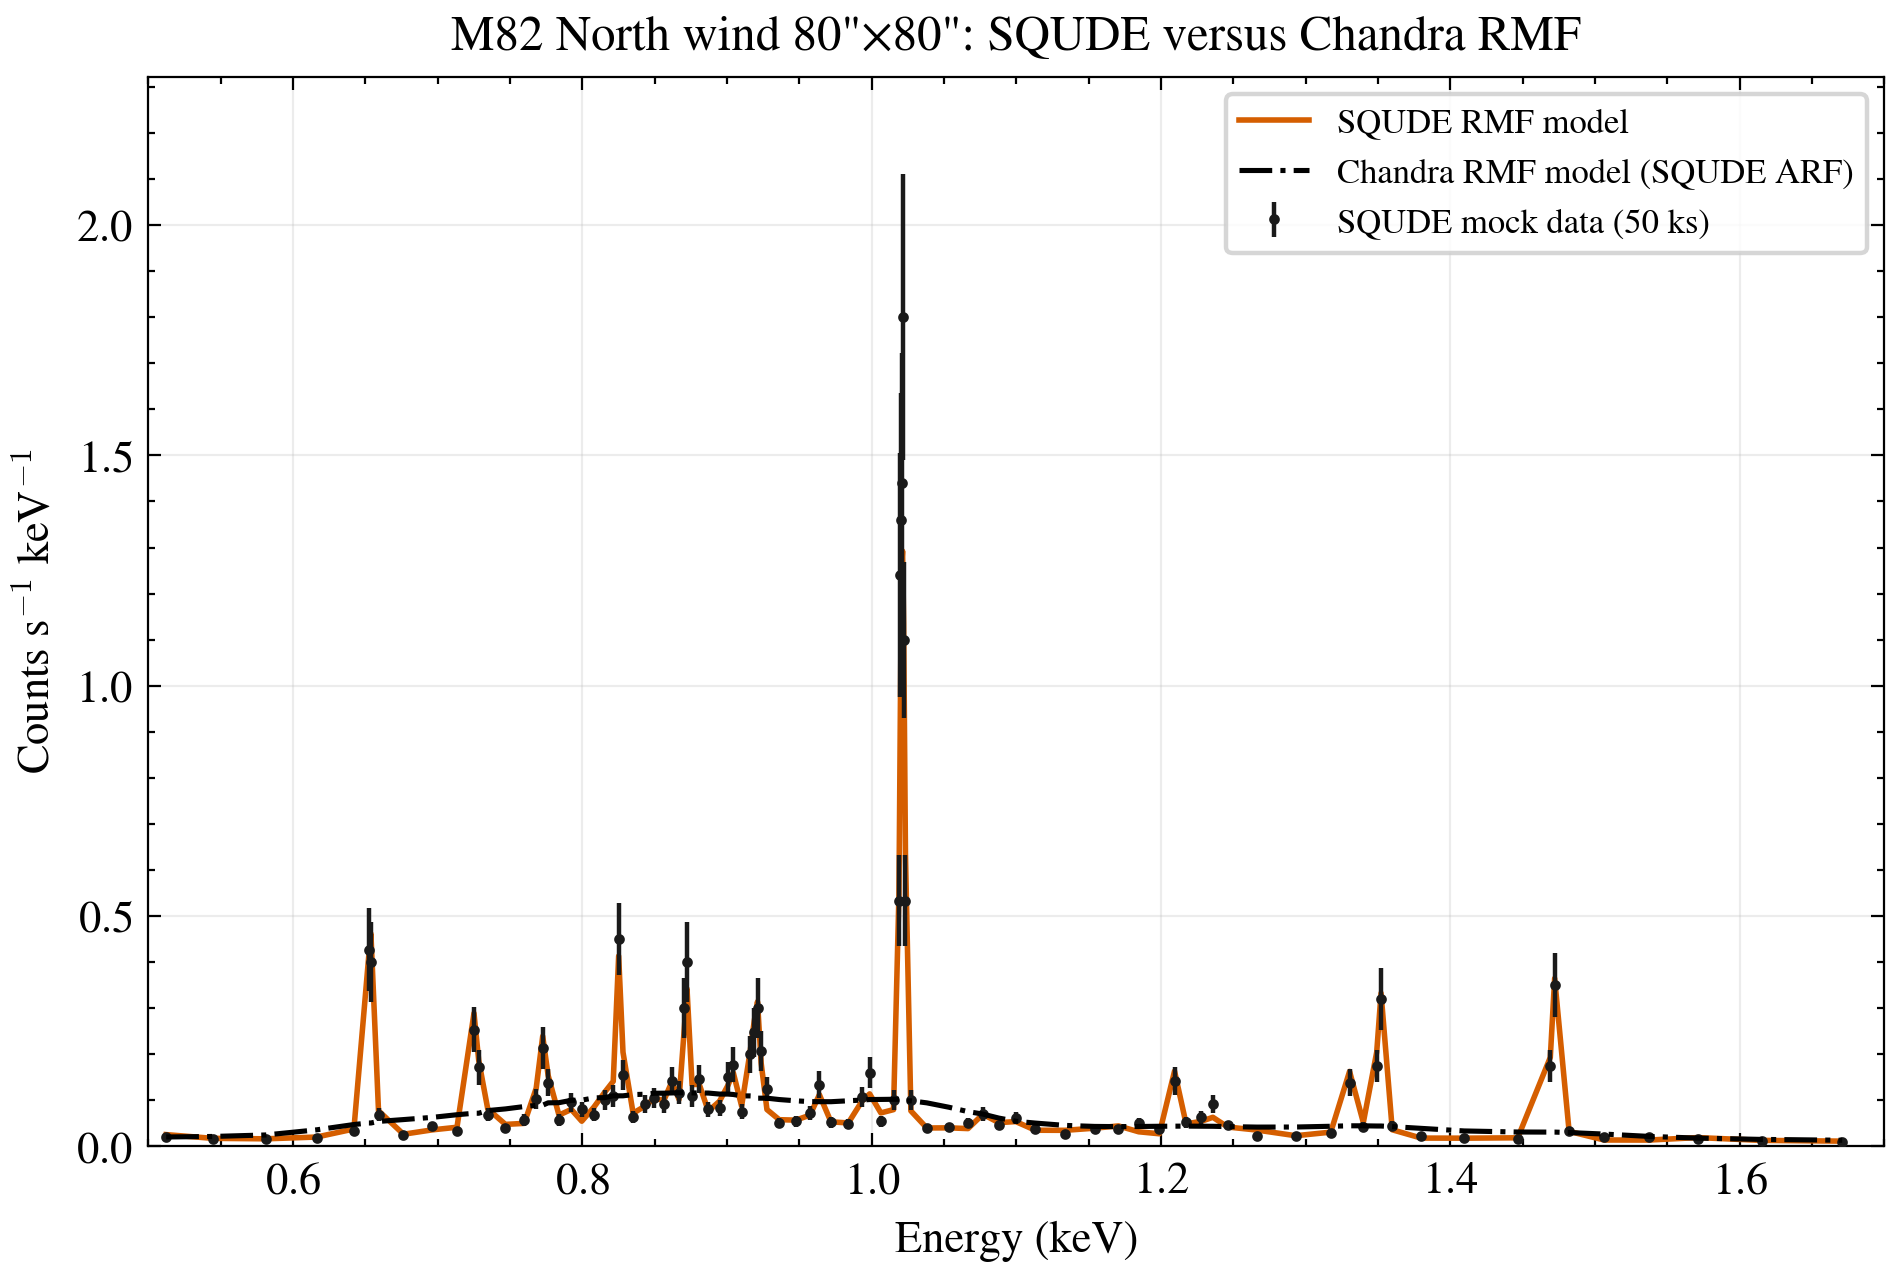
min50 1-columnmin50 2-columnmin30 1-columnmin30 2-column
Center starburst · 40″×80″
Chandra 1-columnChandra 2-column
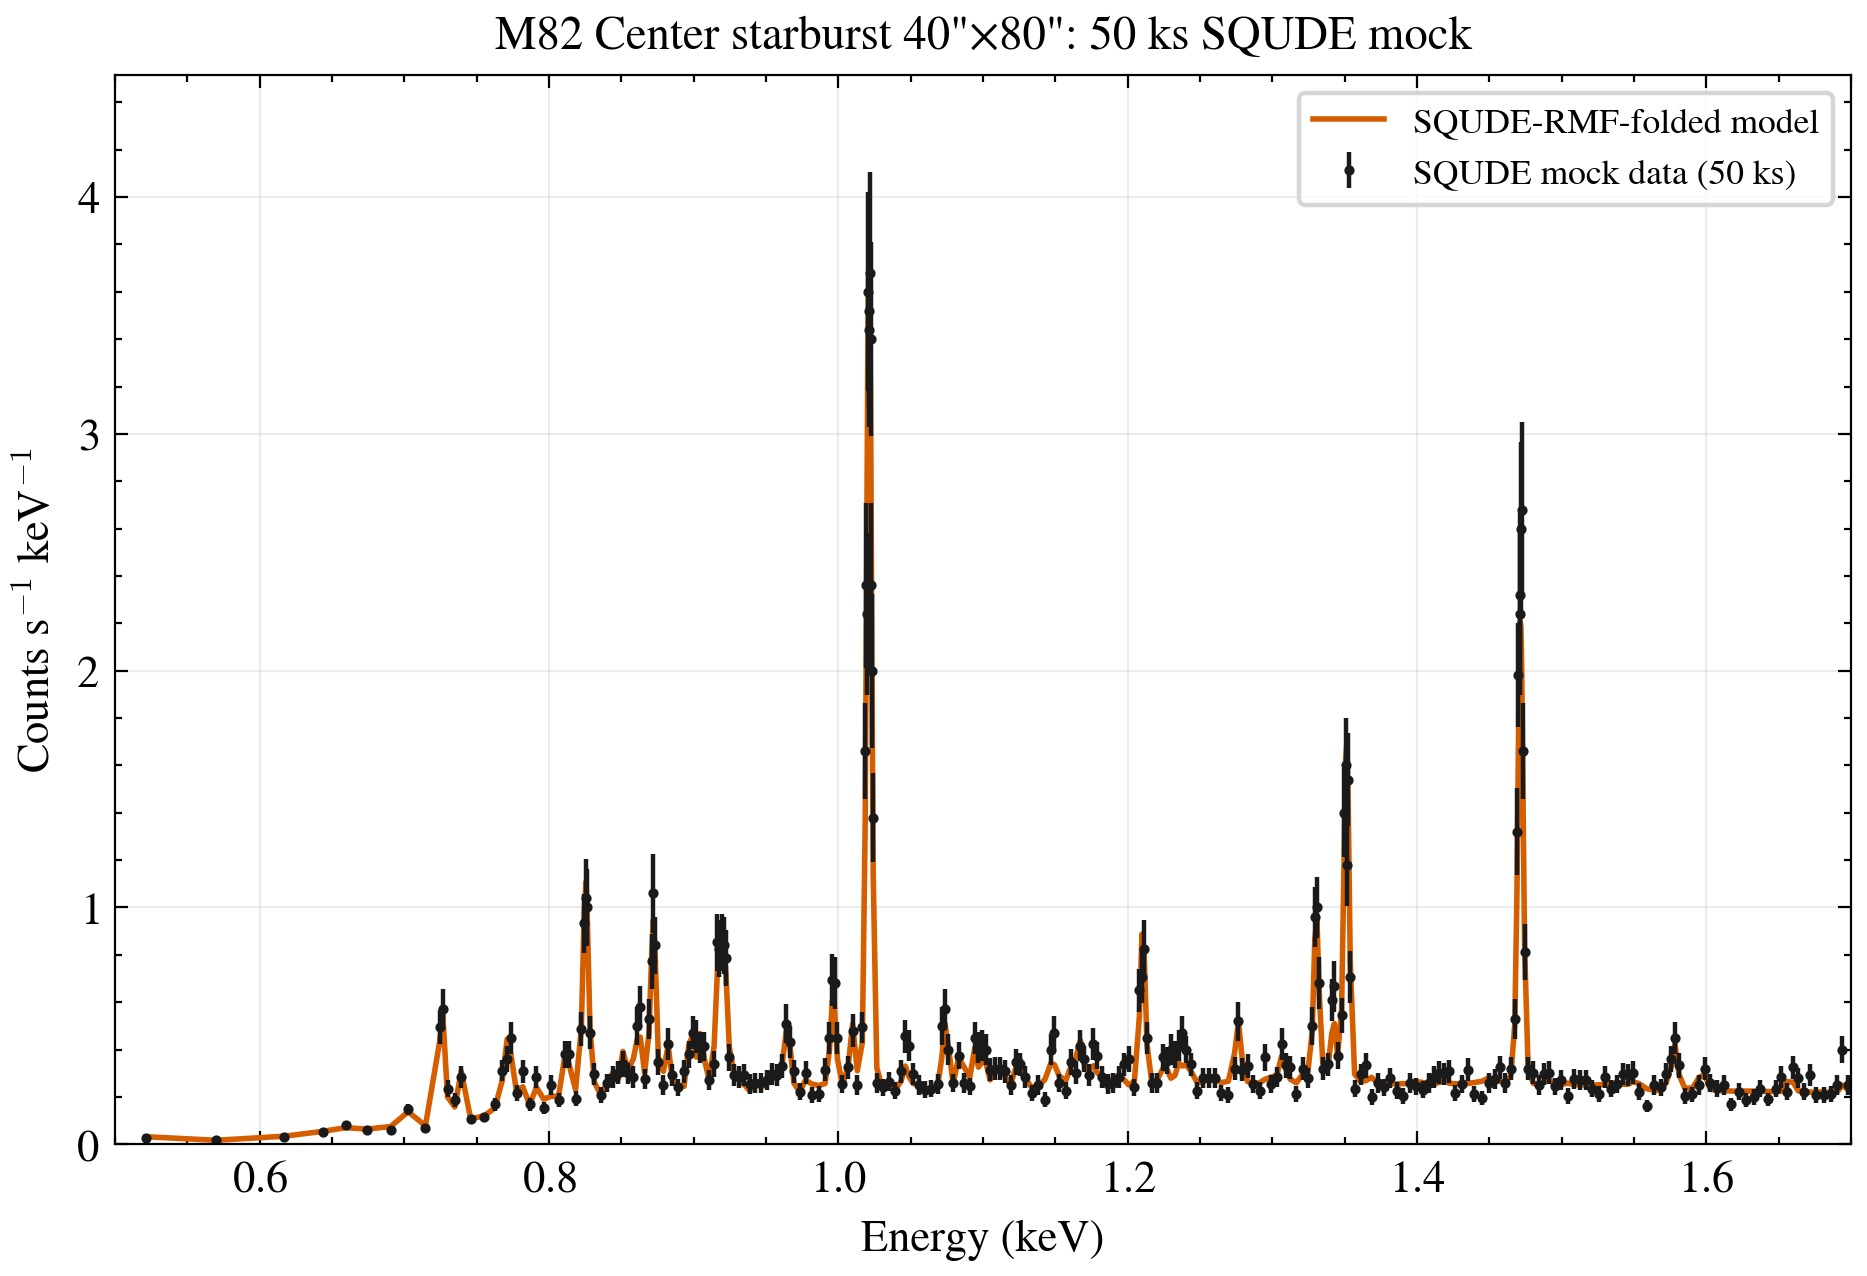
min50 1-columnmin50 2-columnmin30 1-columnmin30 2-column
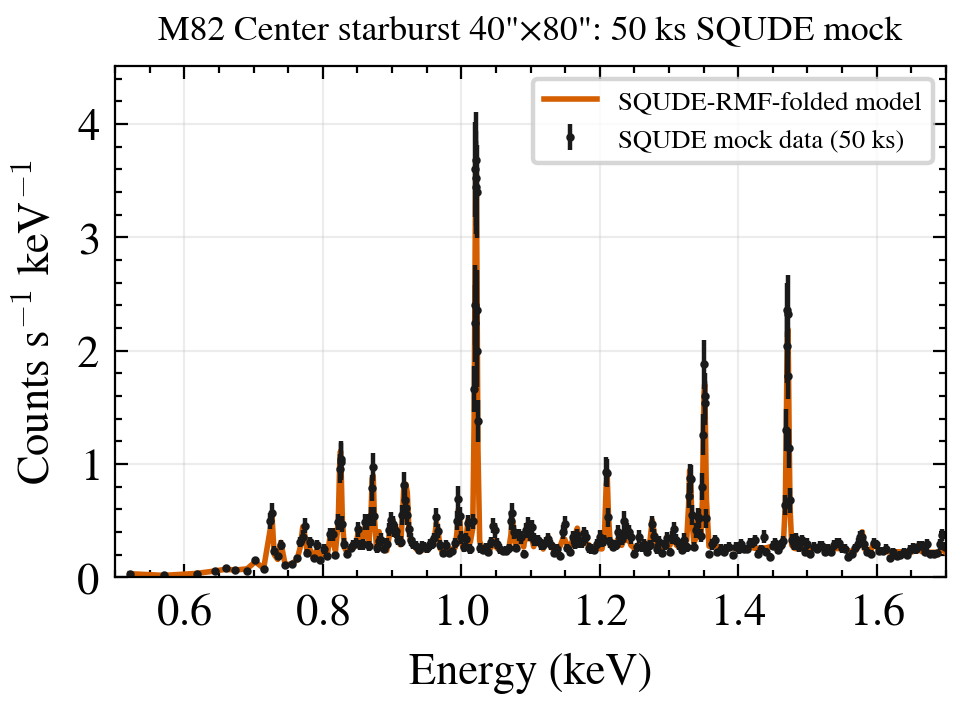
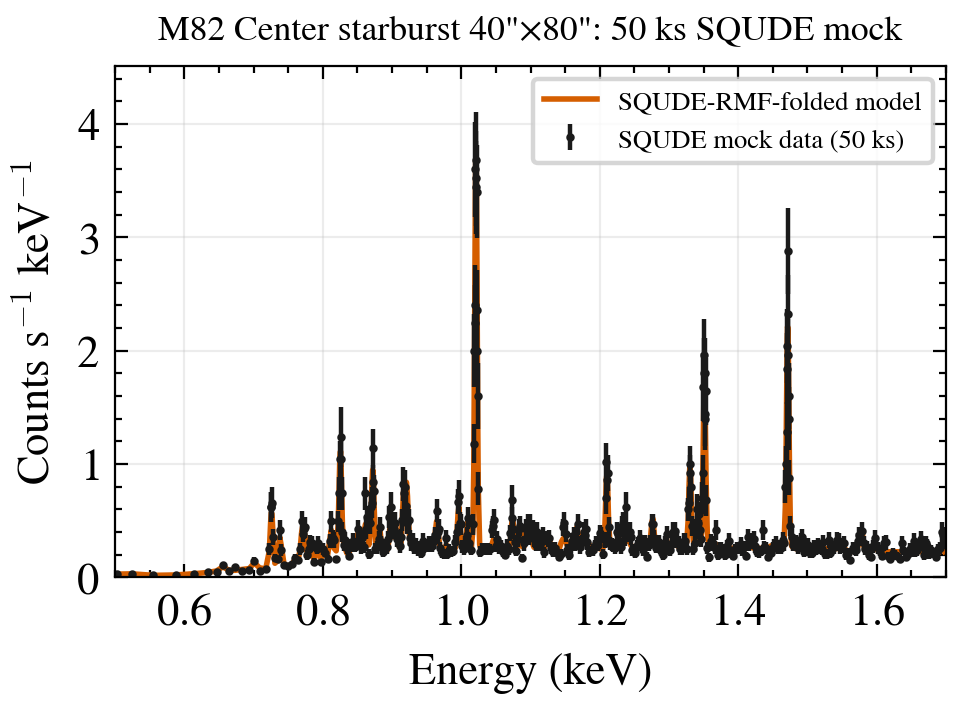
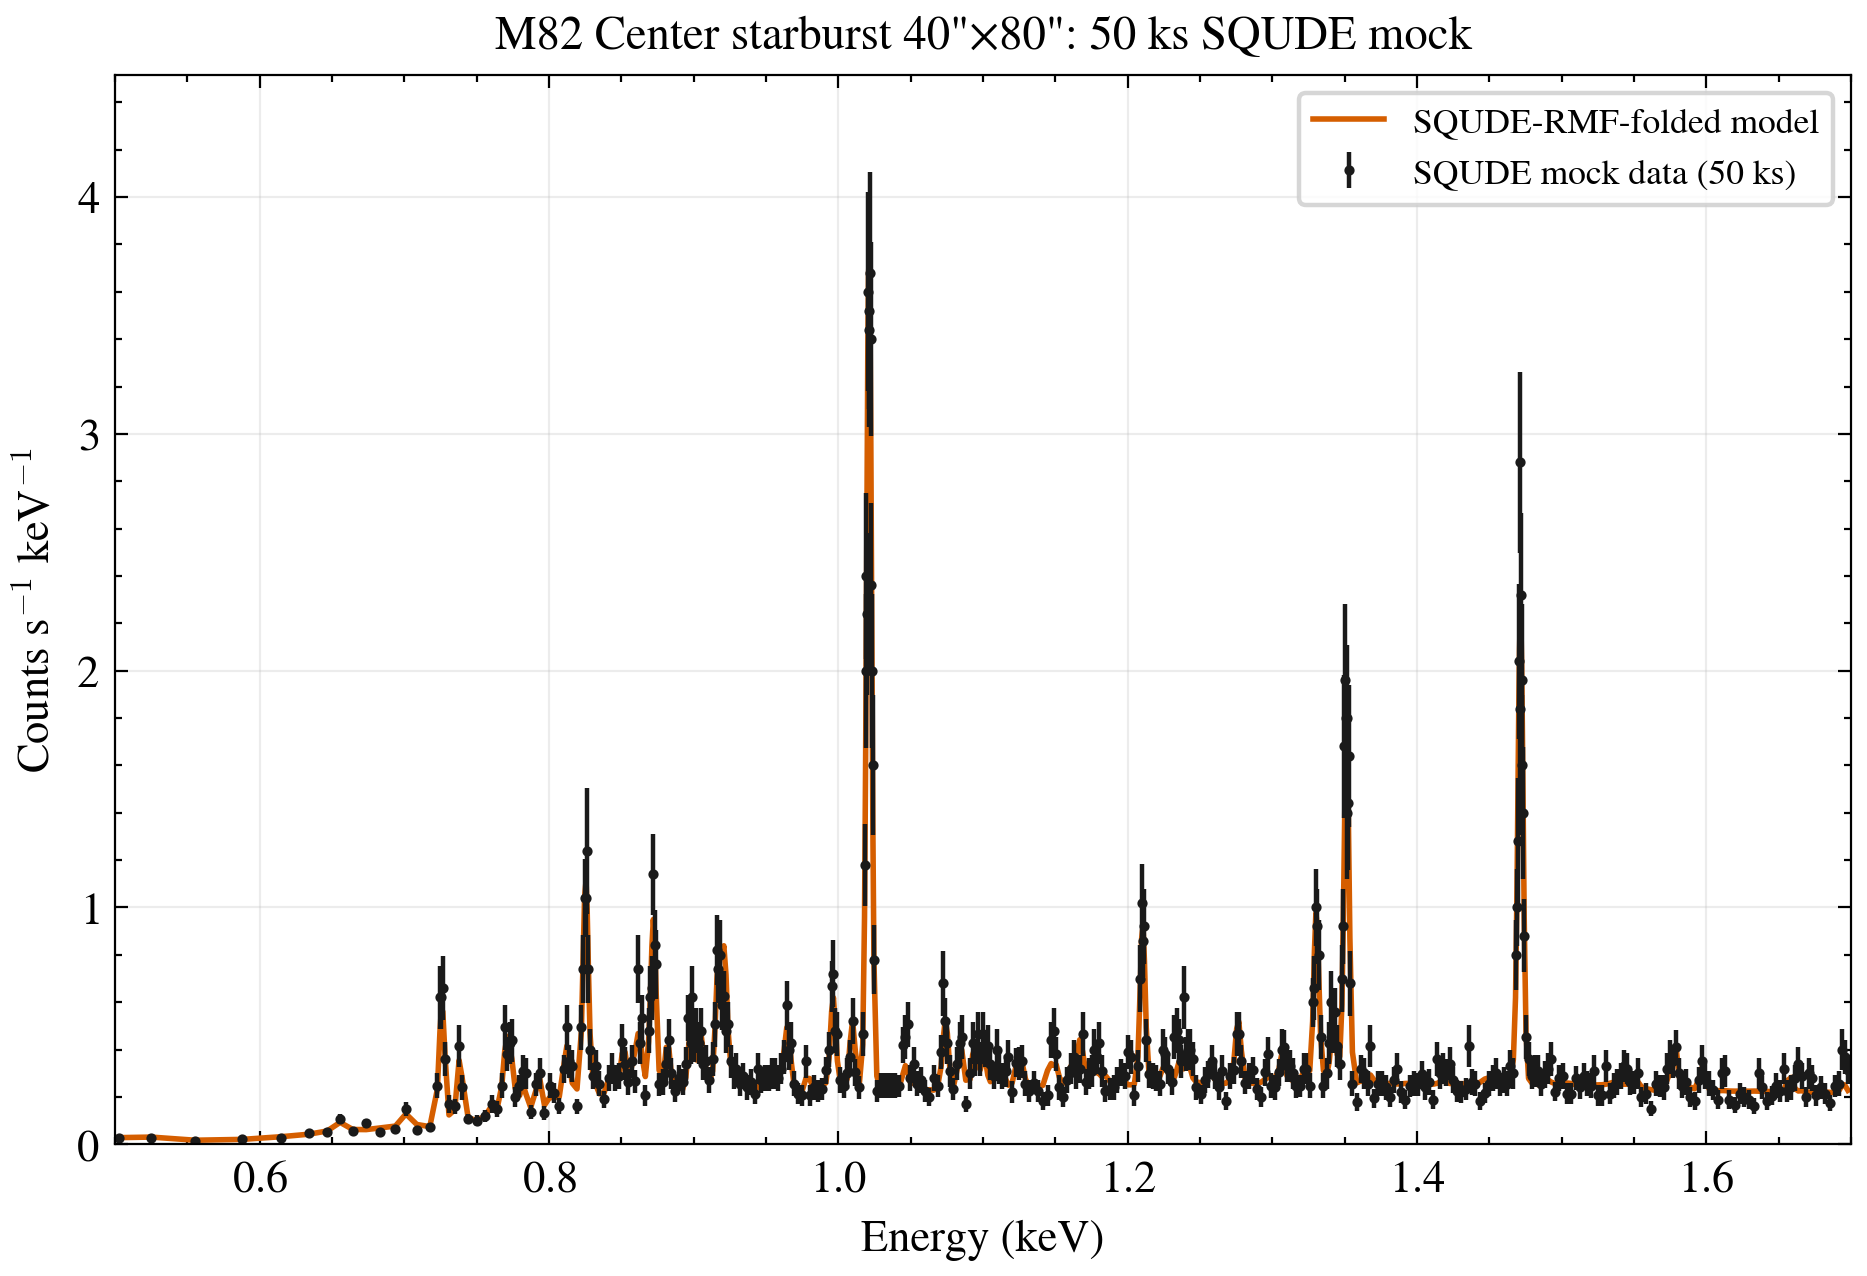
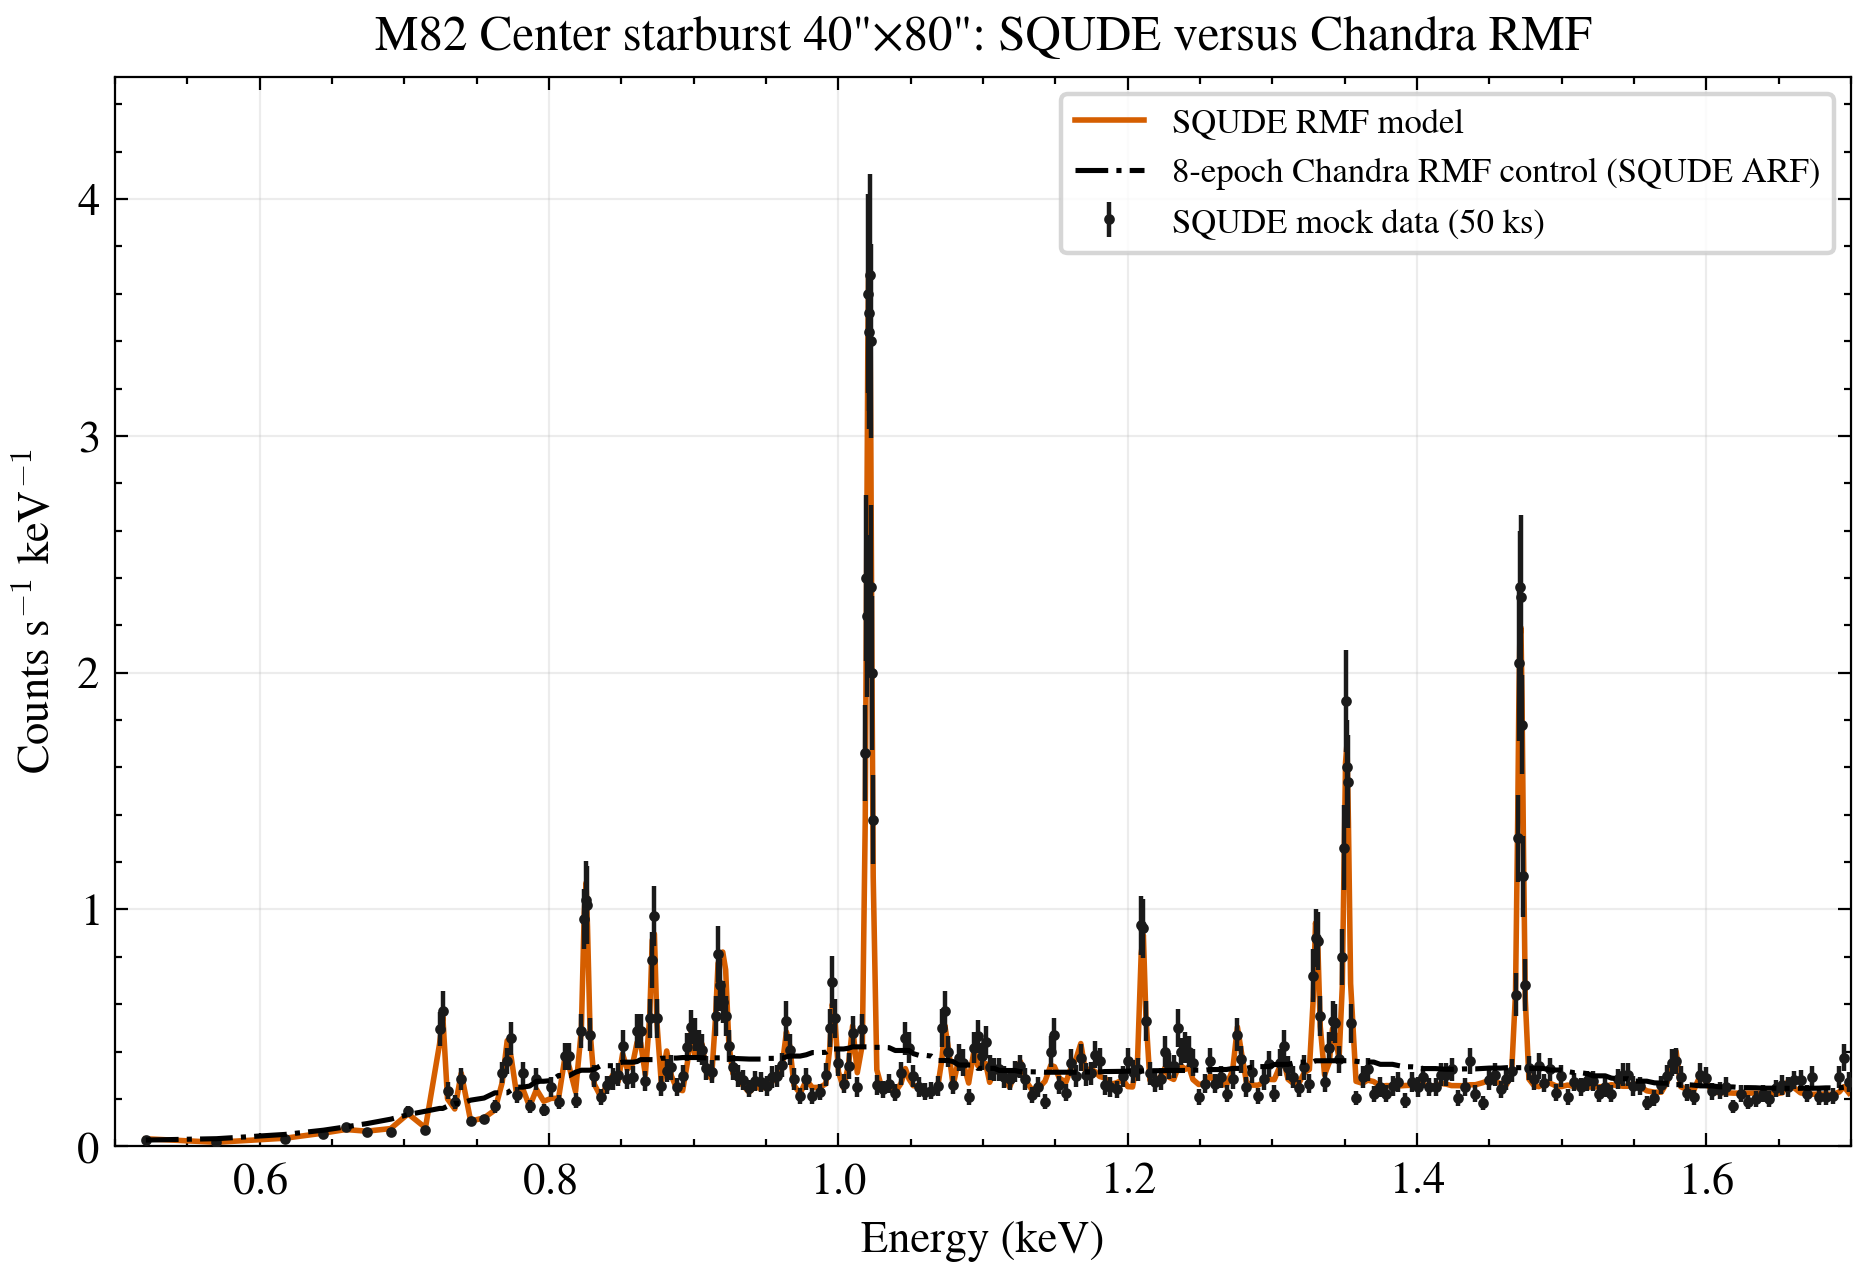 min30 · 30 counts/binmin50 · 50 counts/bin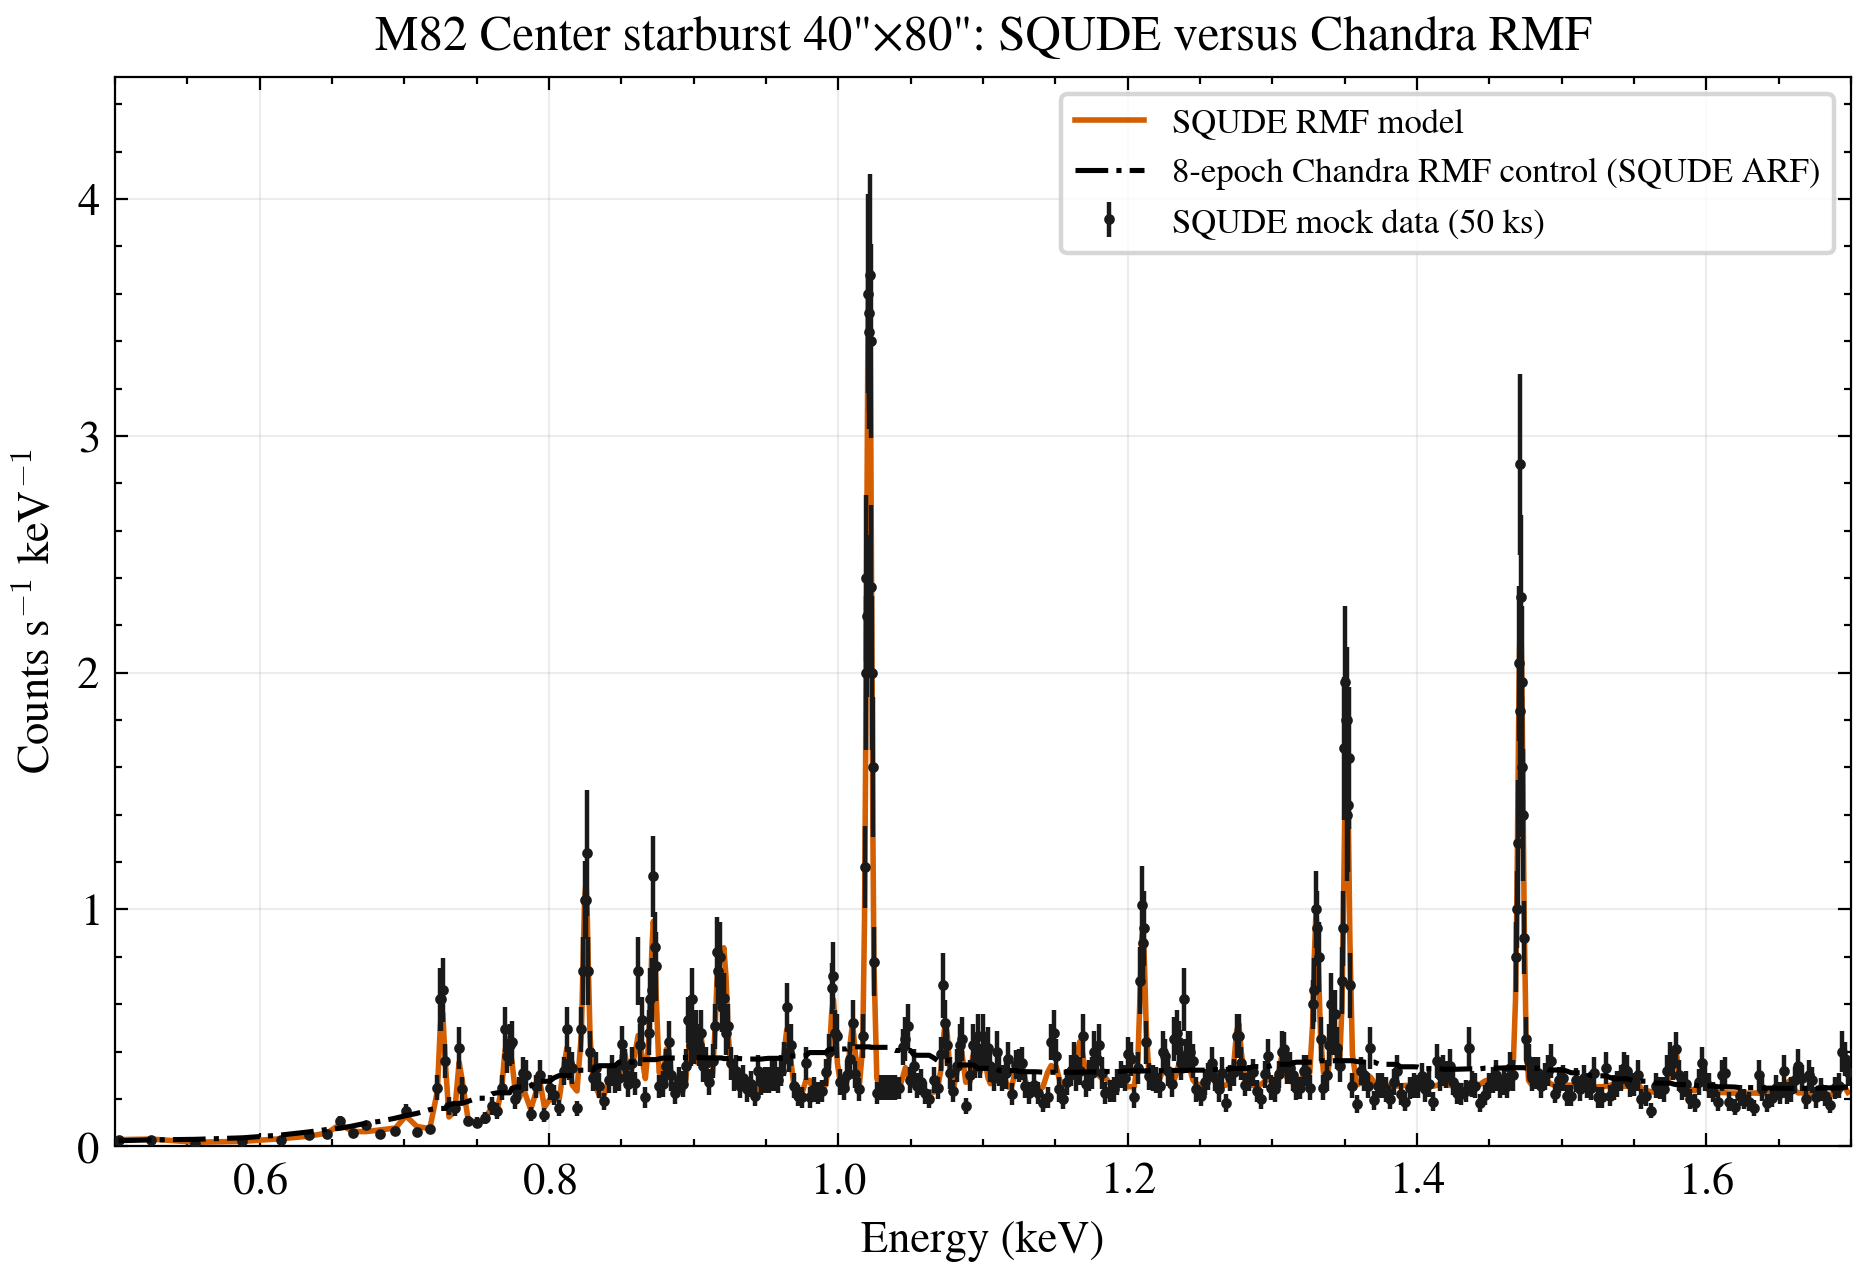
min50 1-columnmin50 2-columnmin30 1-columnmin30 2-column
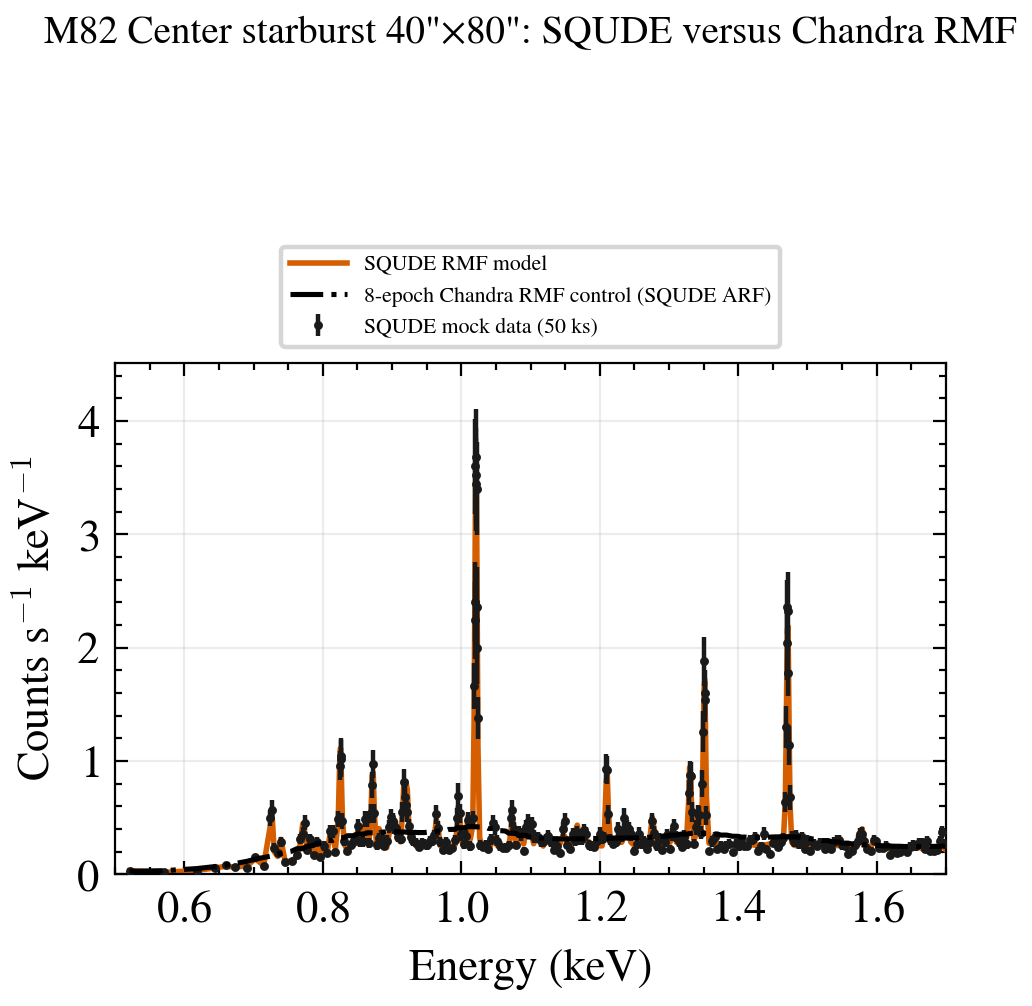
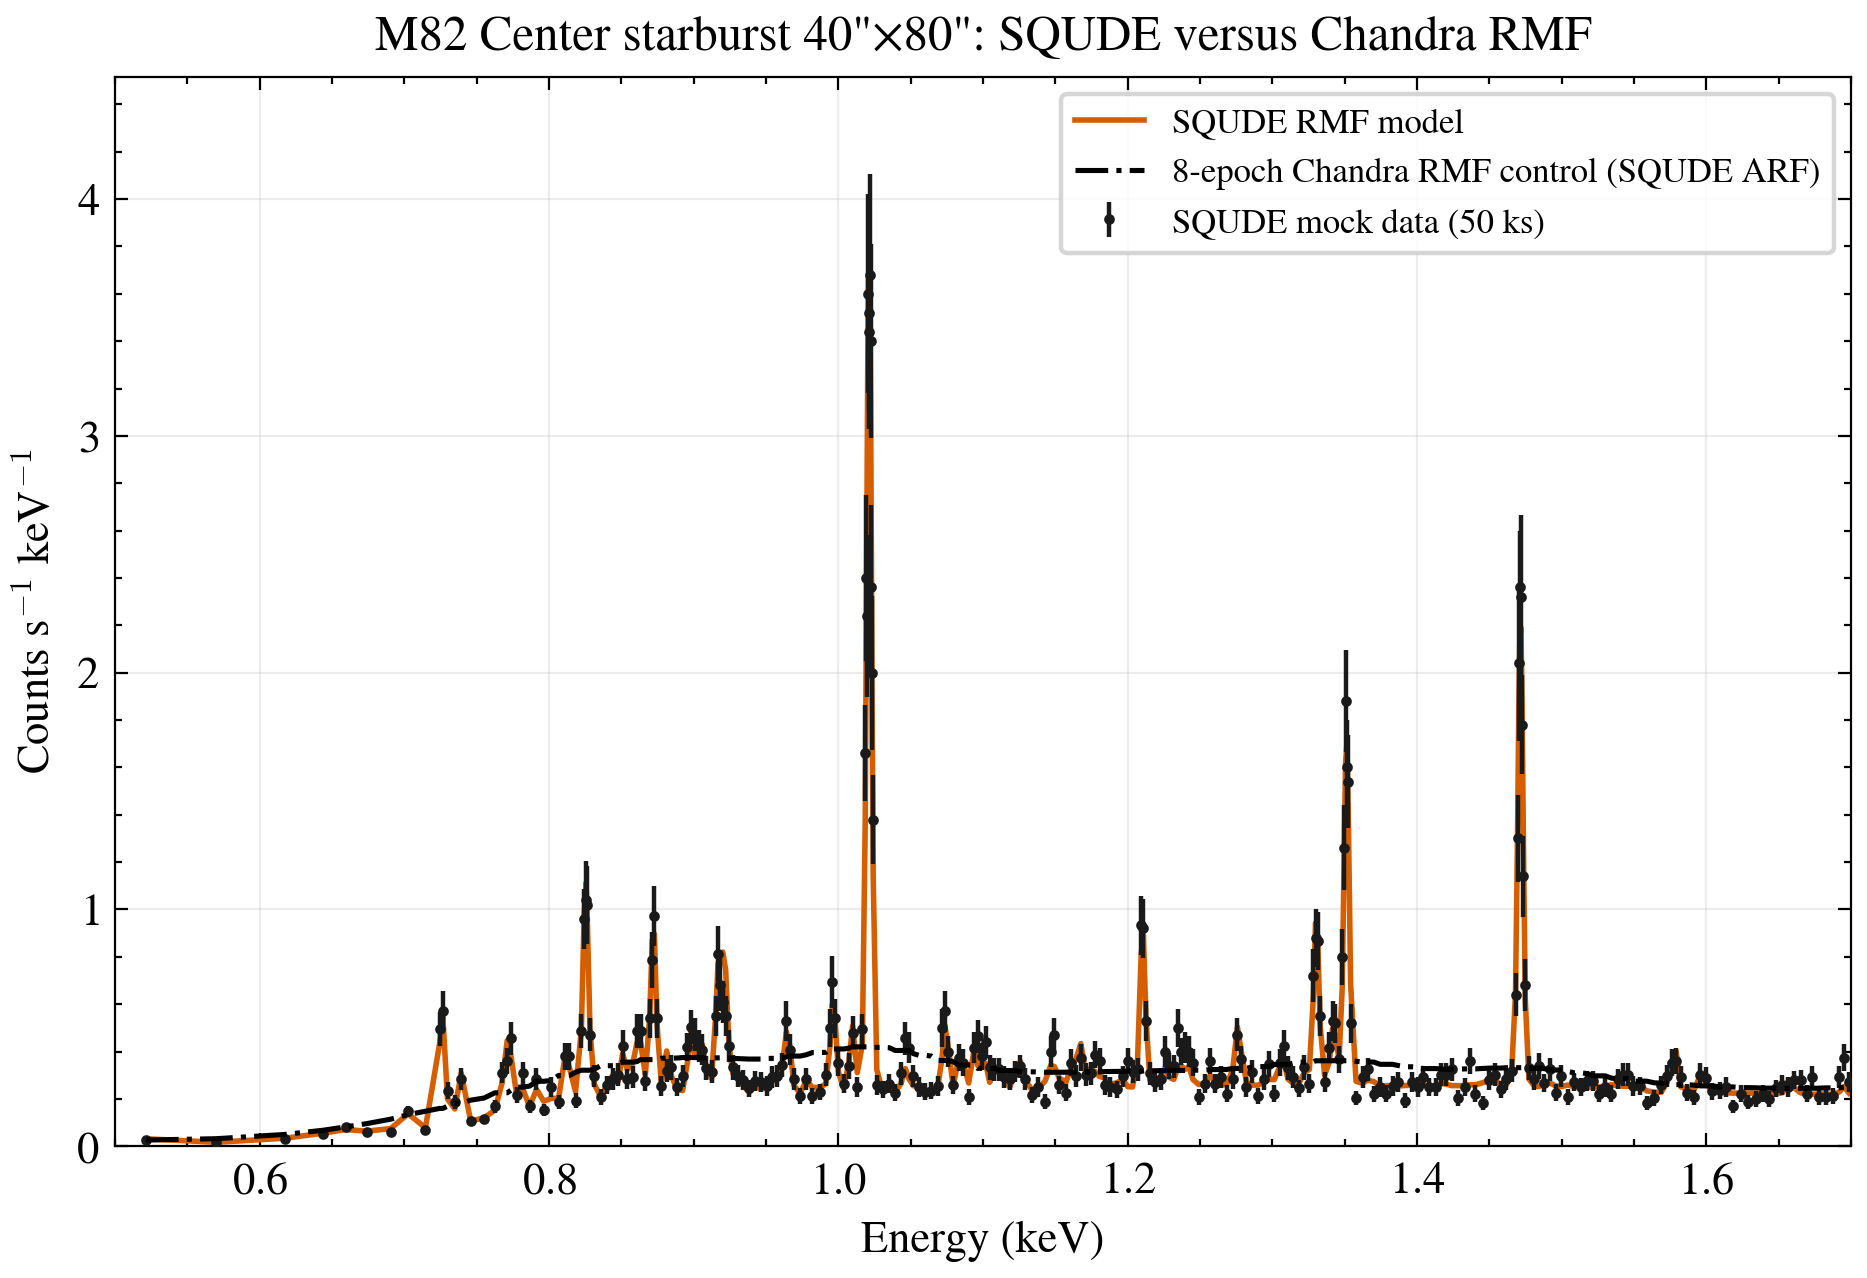
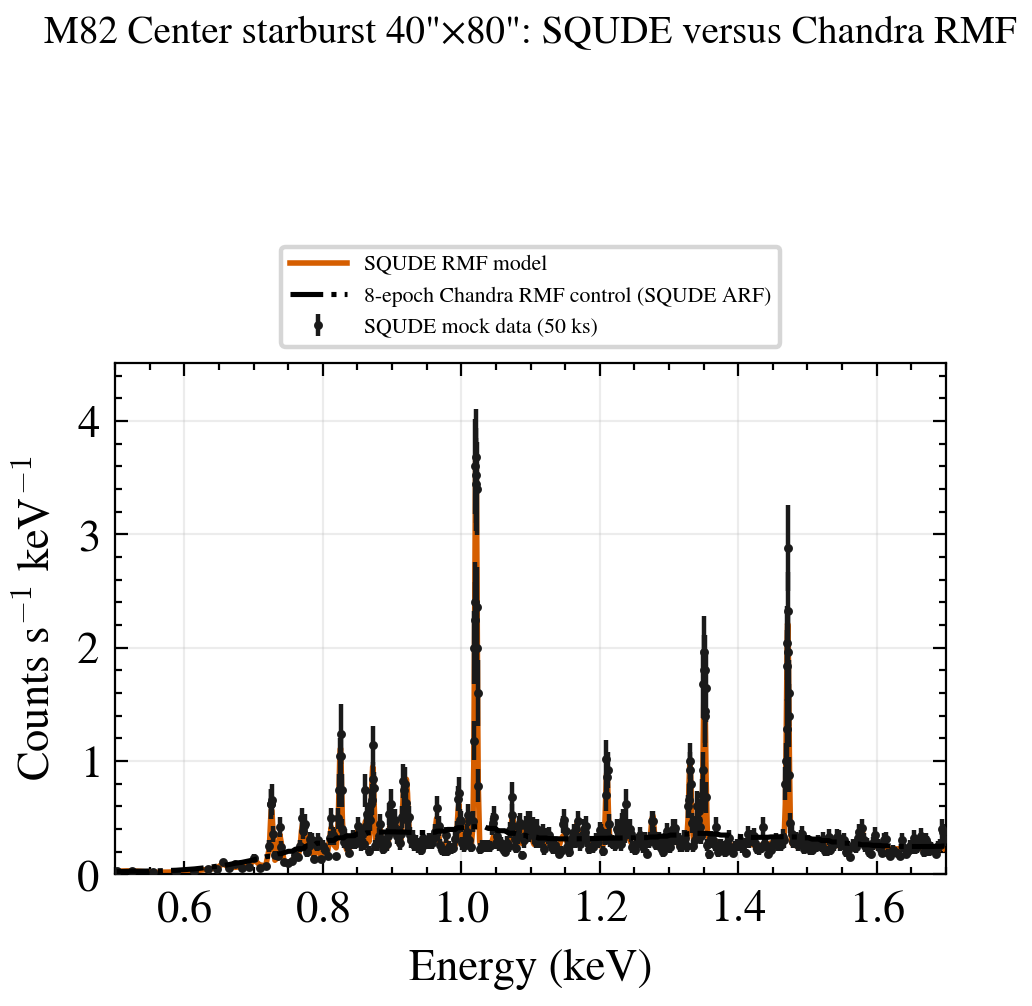
South wind · 80″×80″
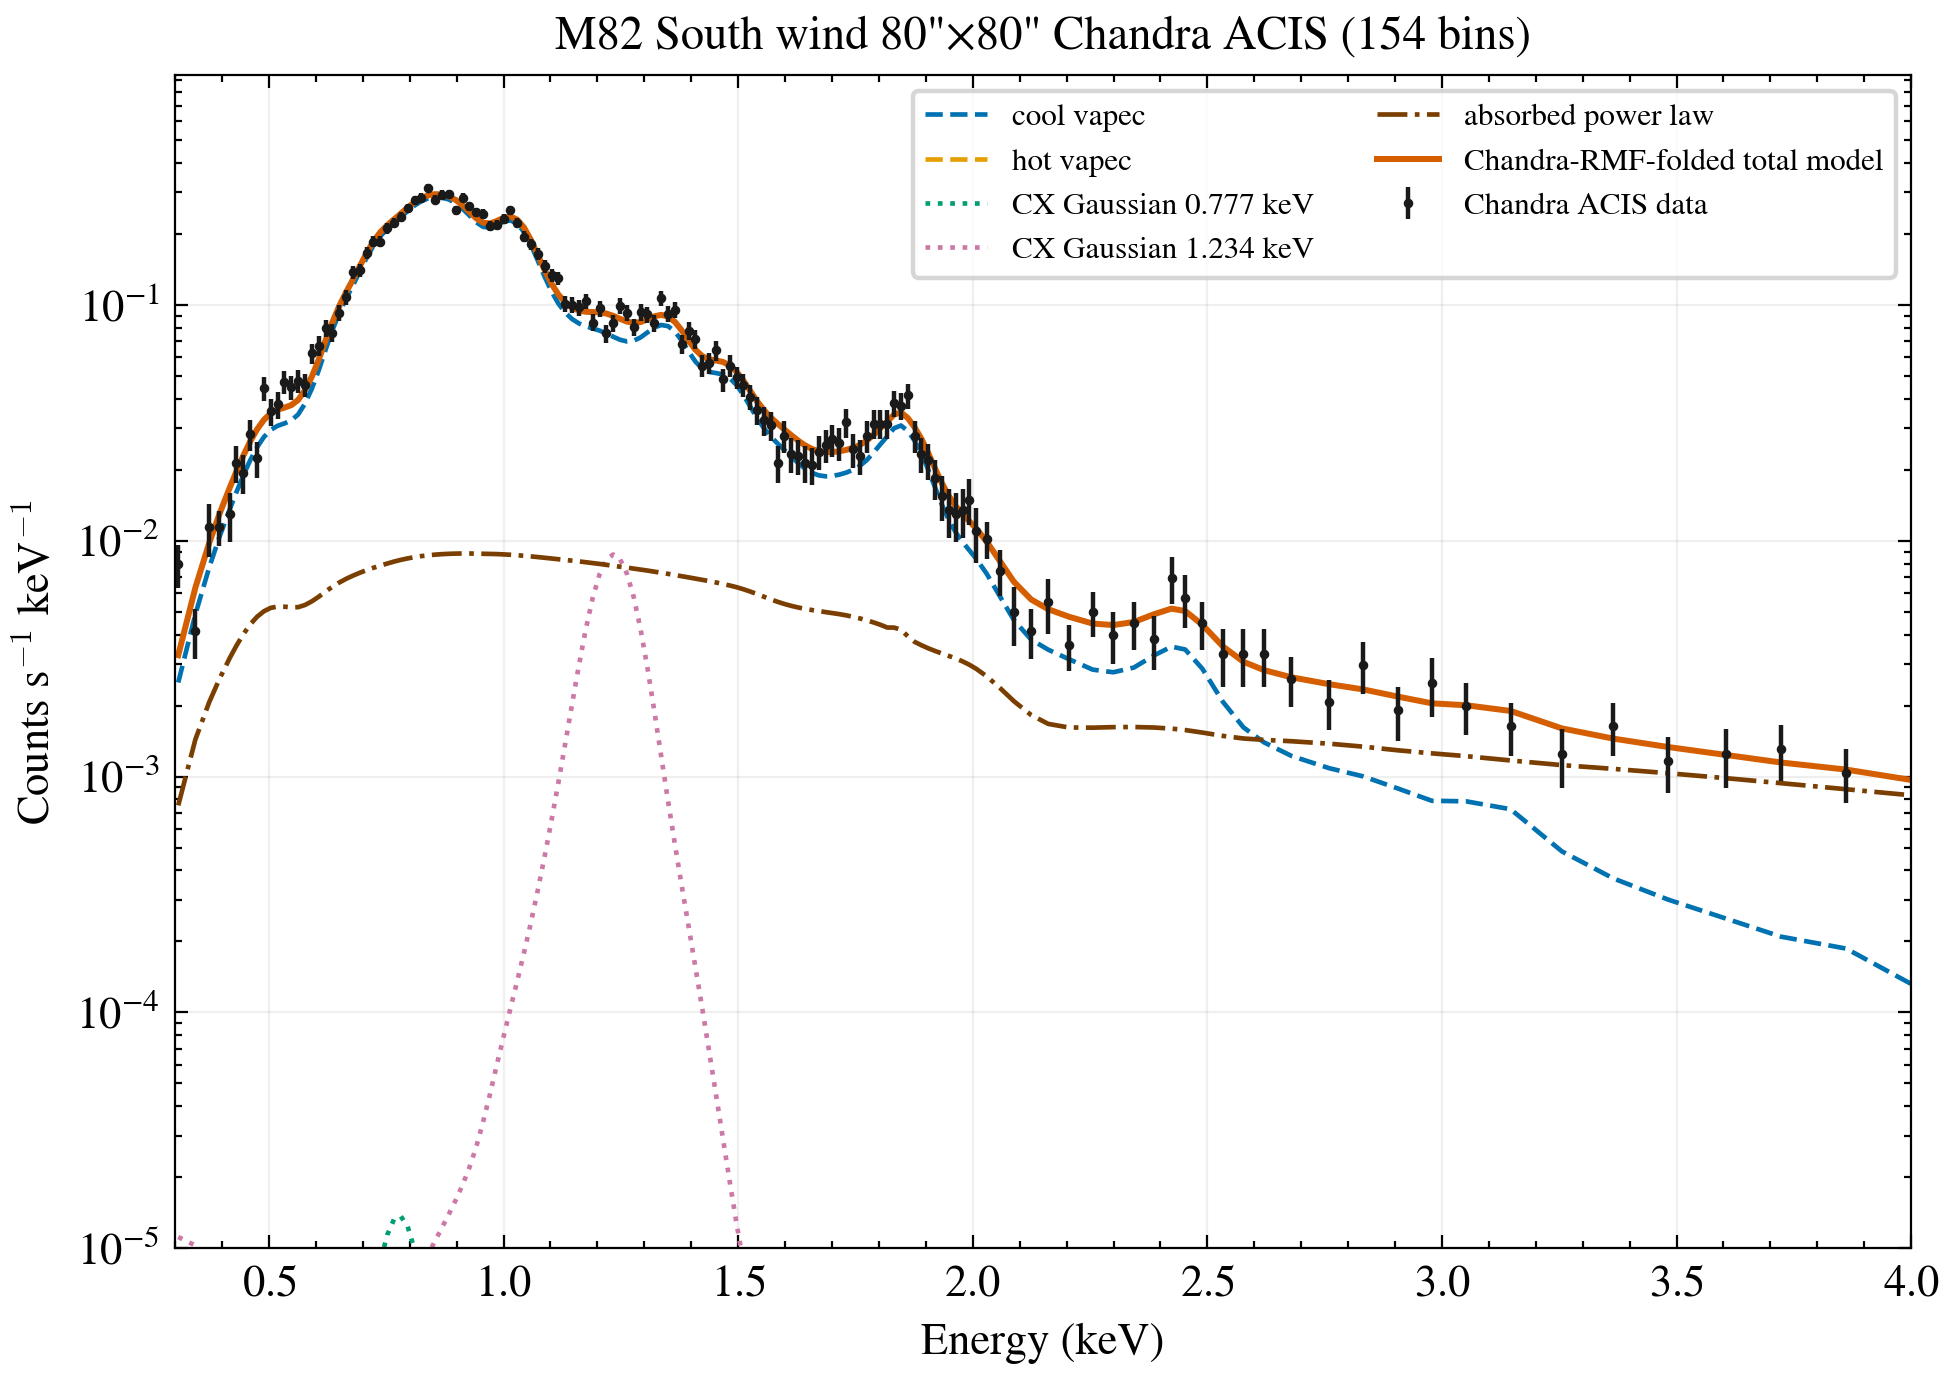
Chandra 1-columnChandra 2-column
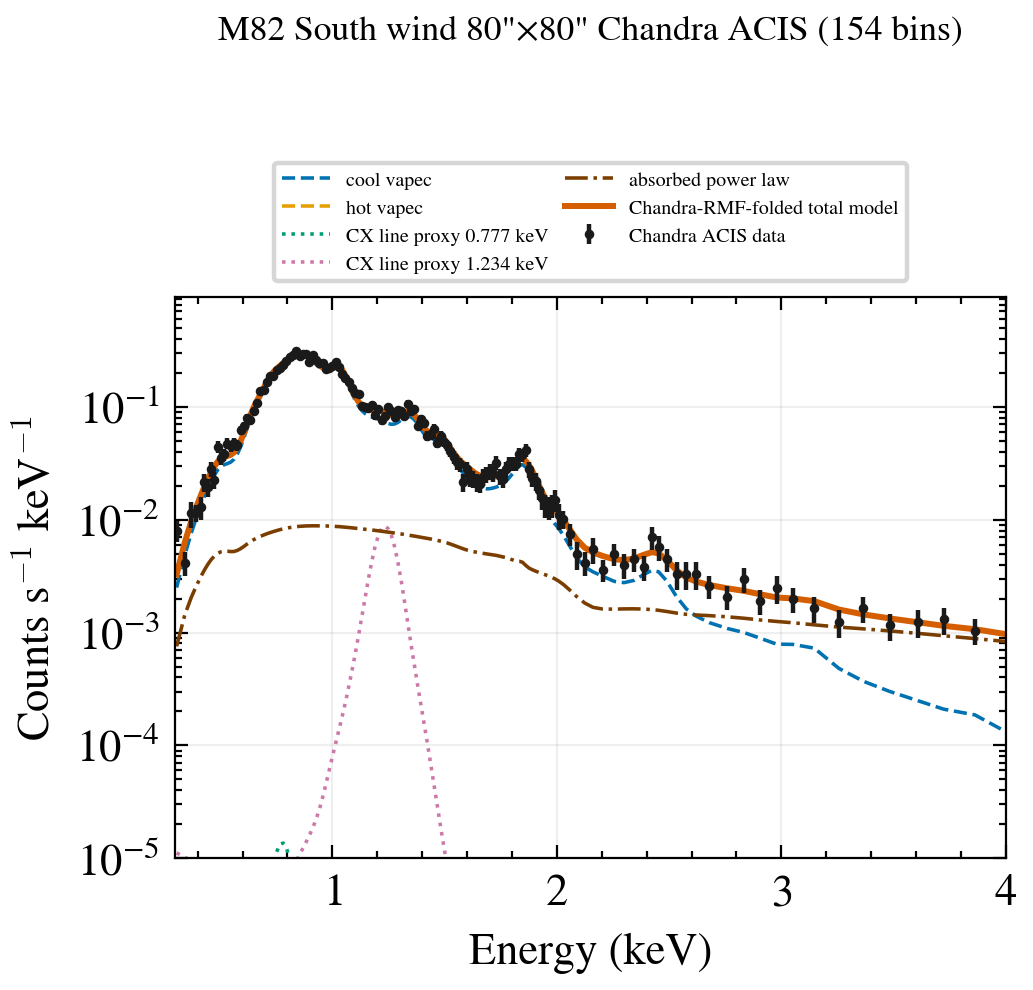
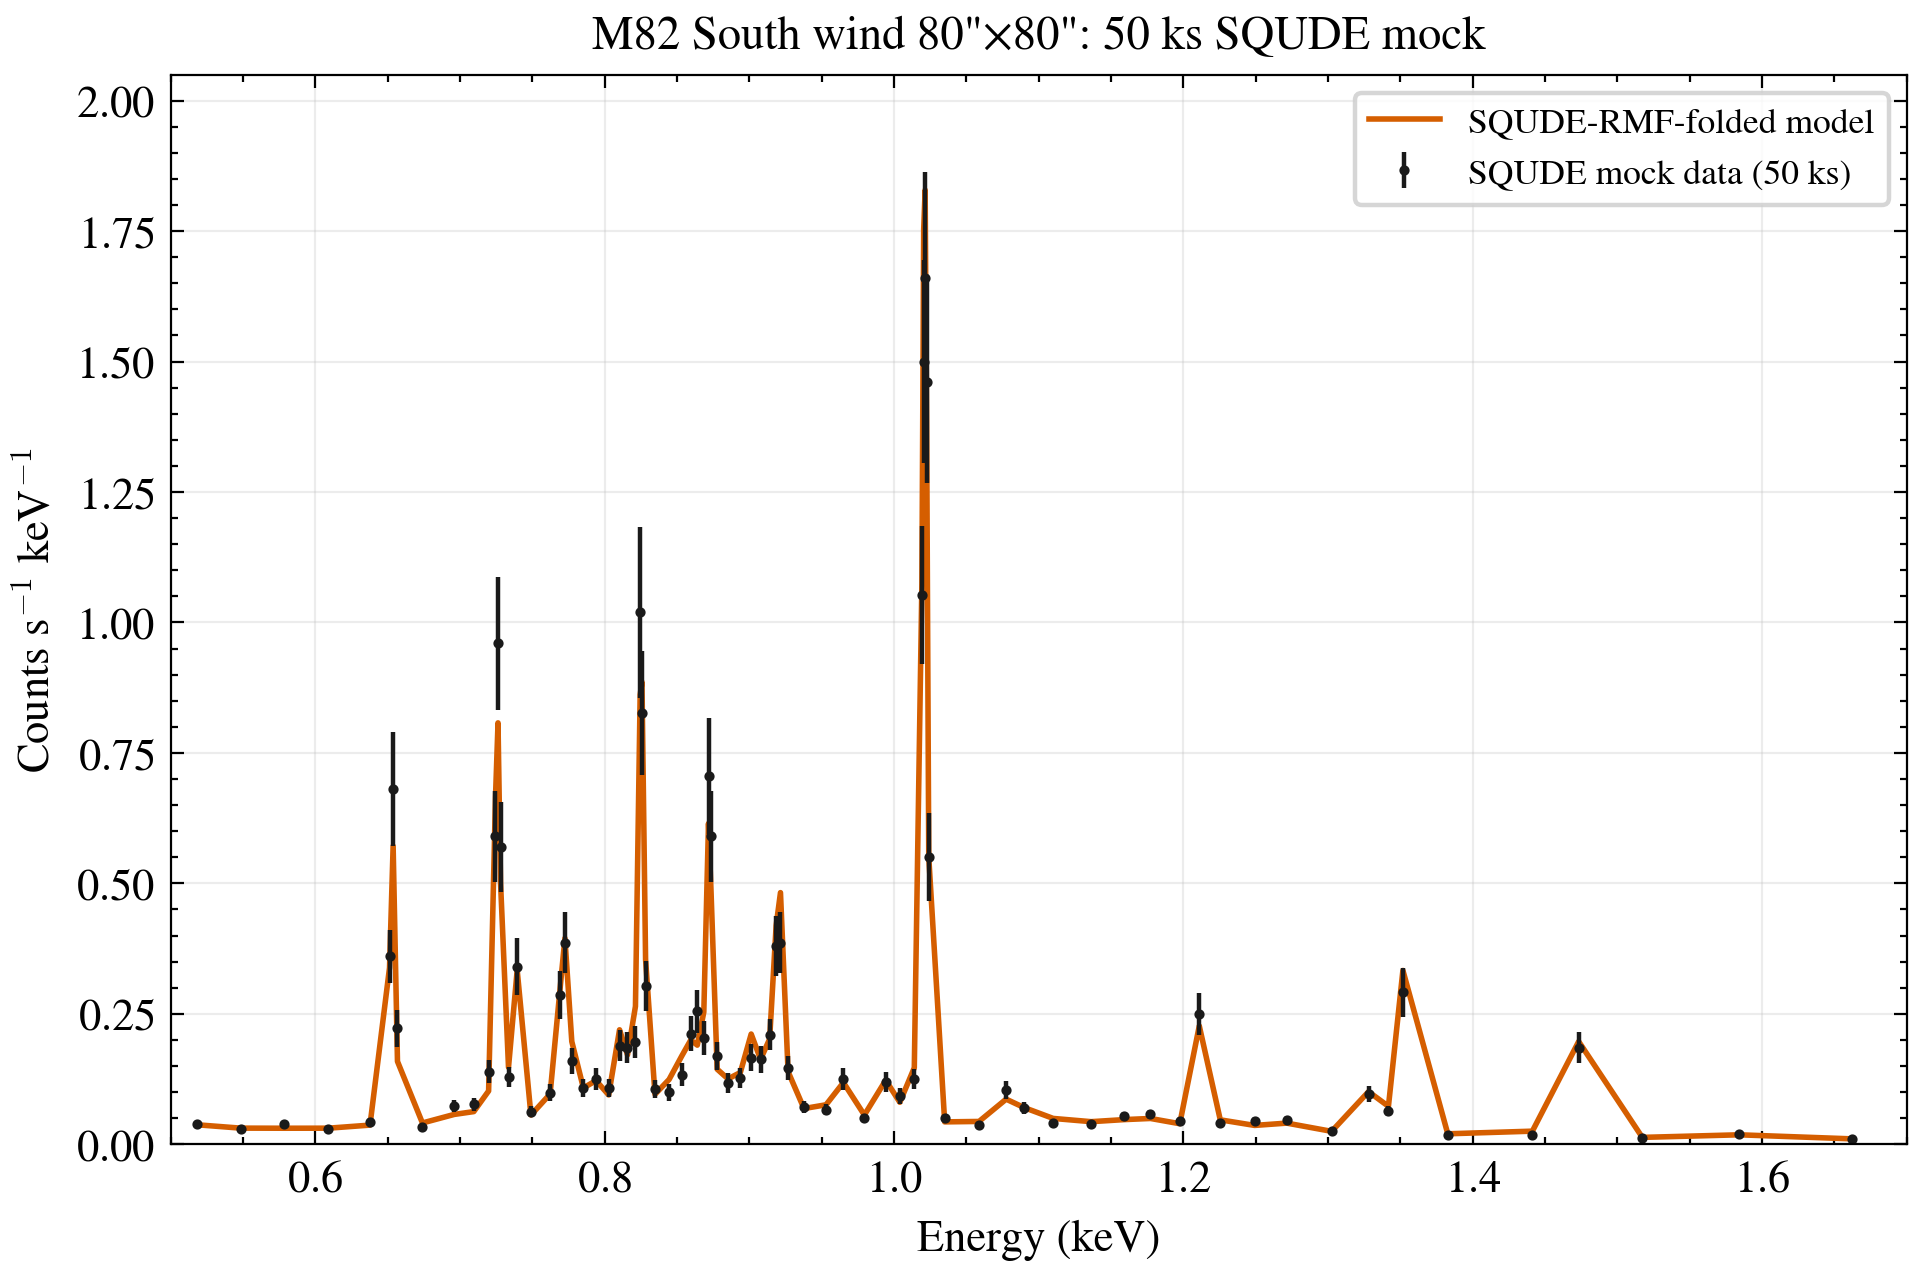
min50 1-columnmin50 2-columnmin30 1-columnmin30 2-column
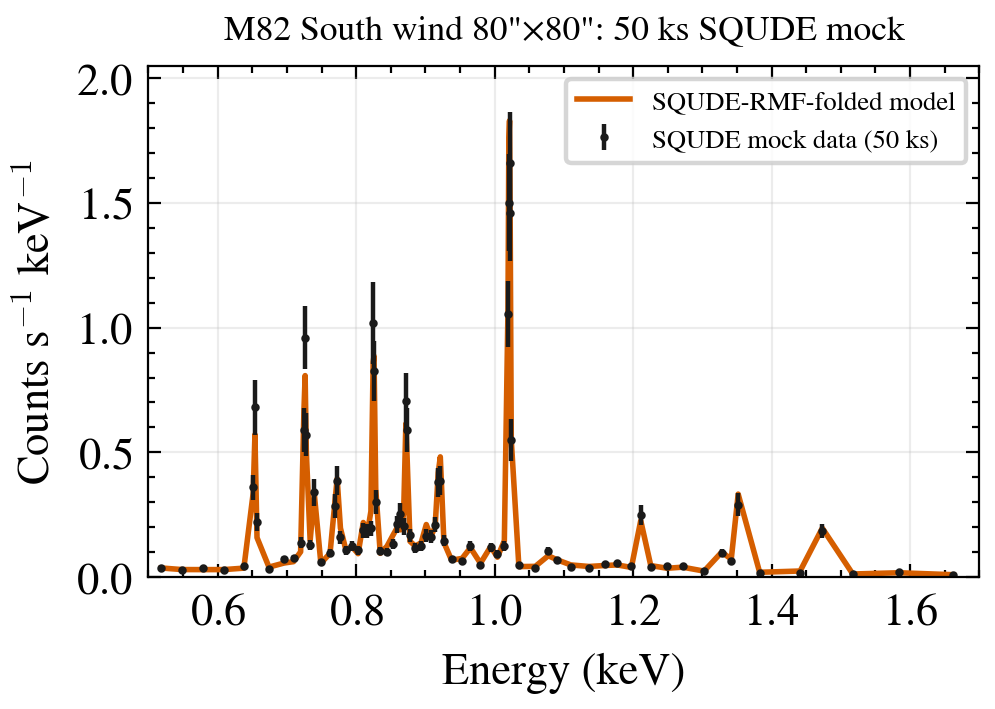
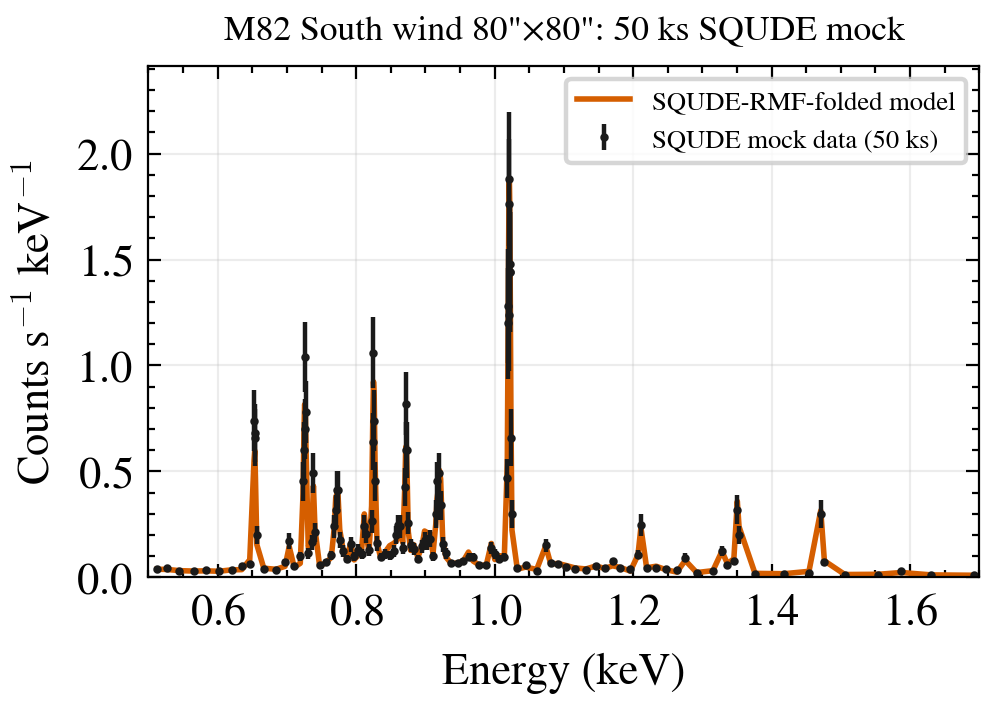
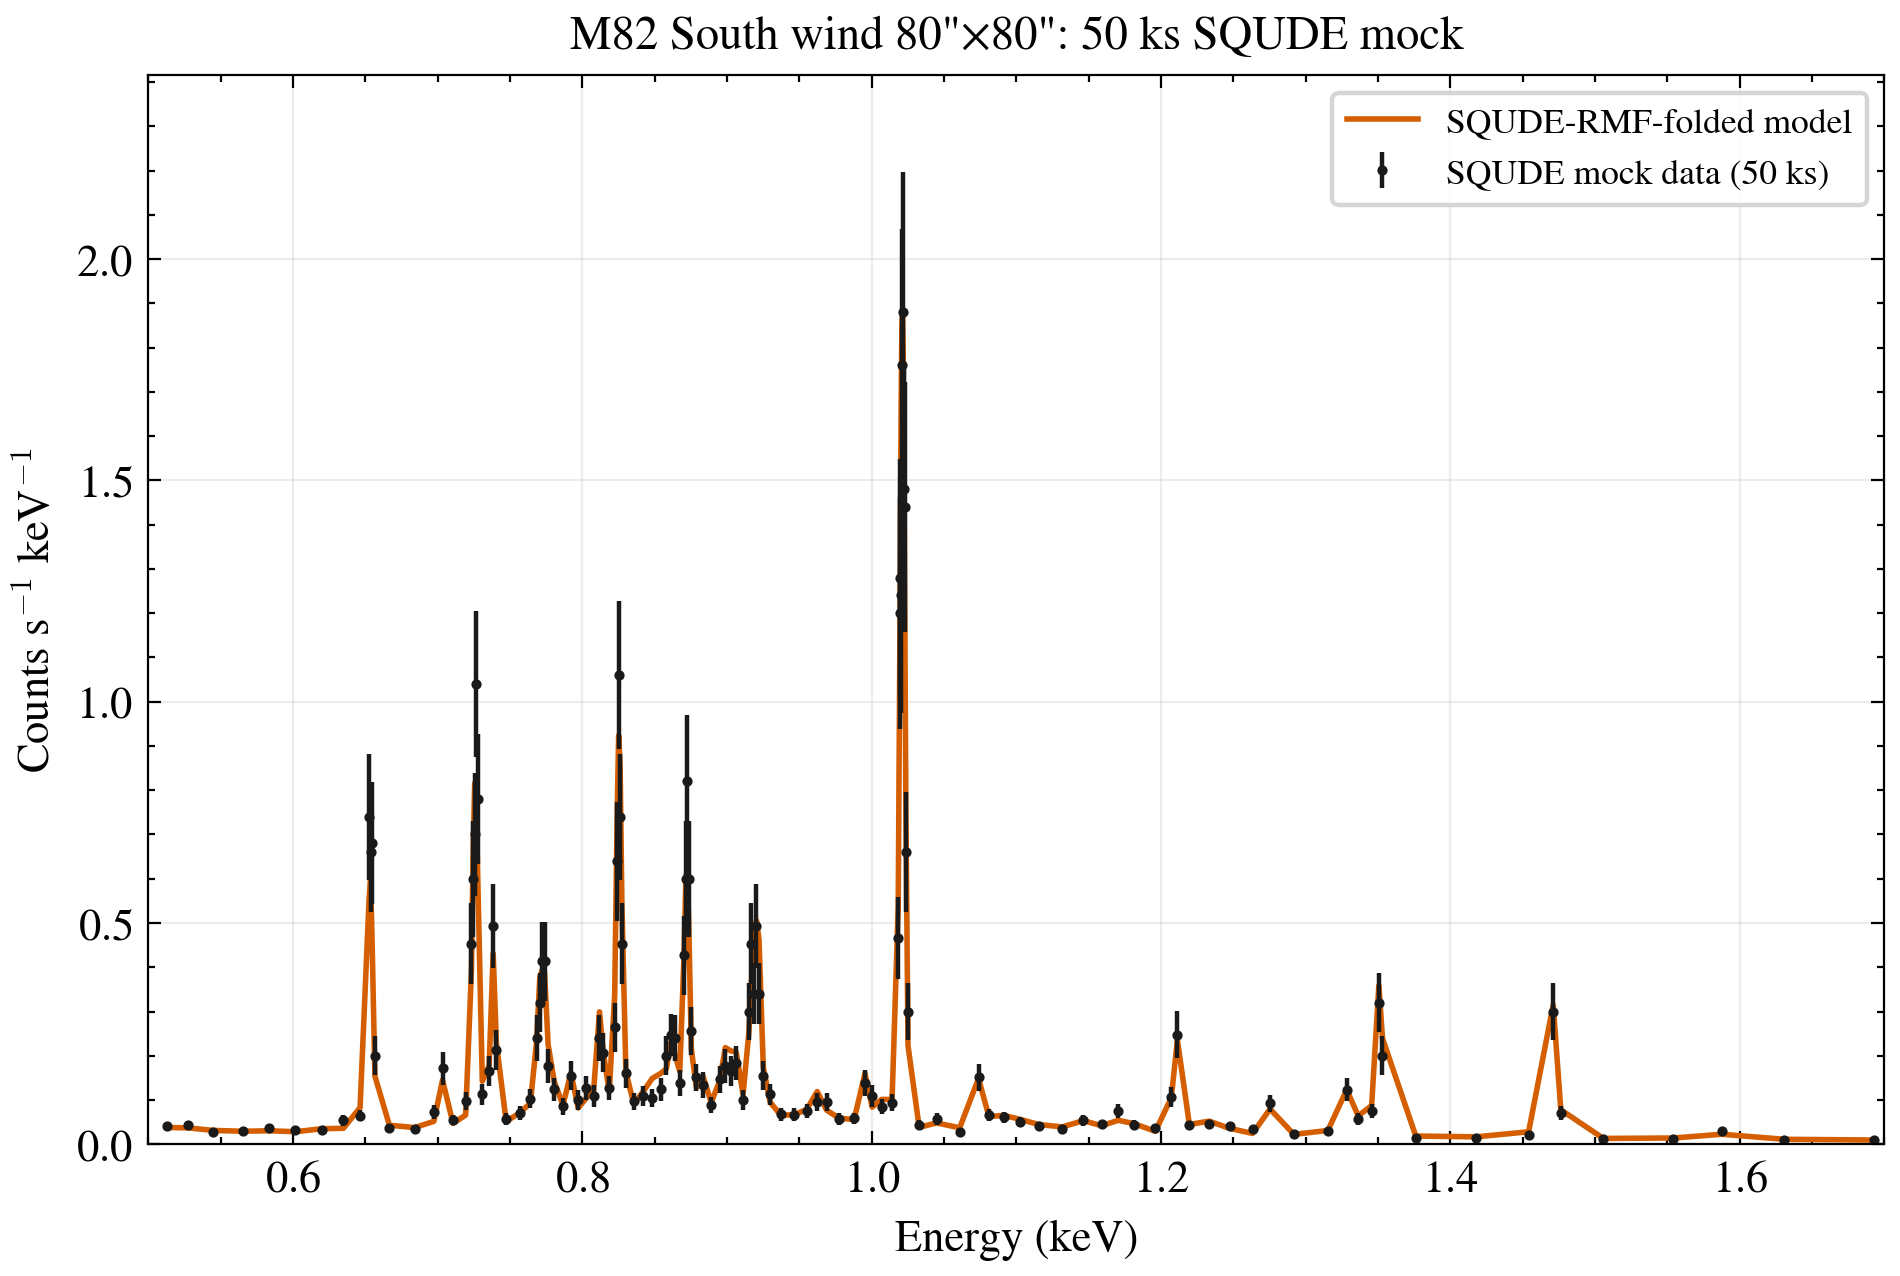
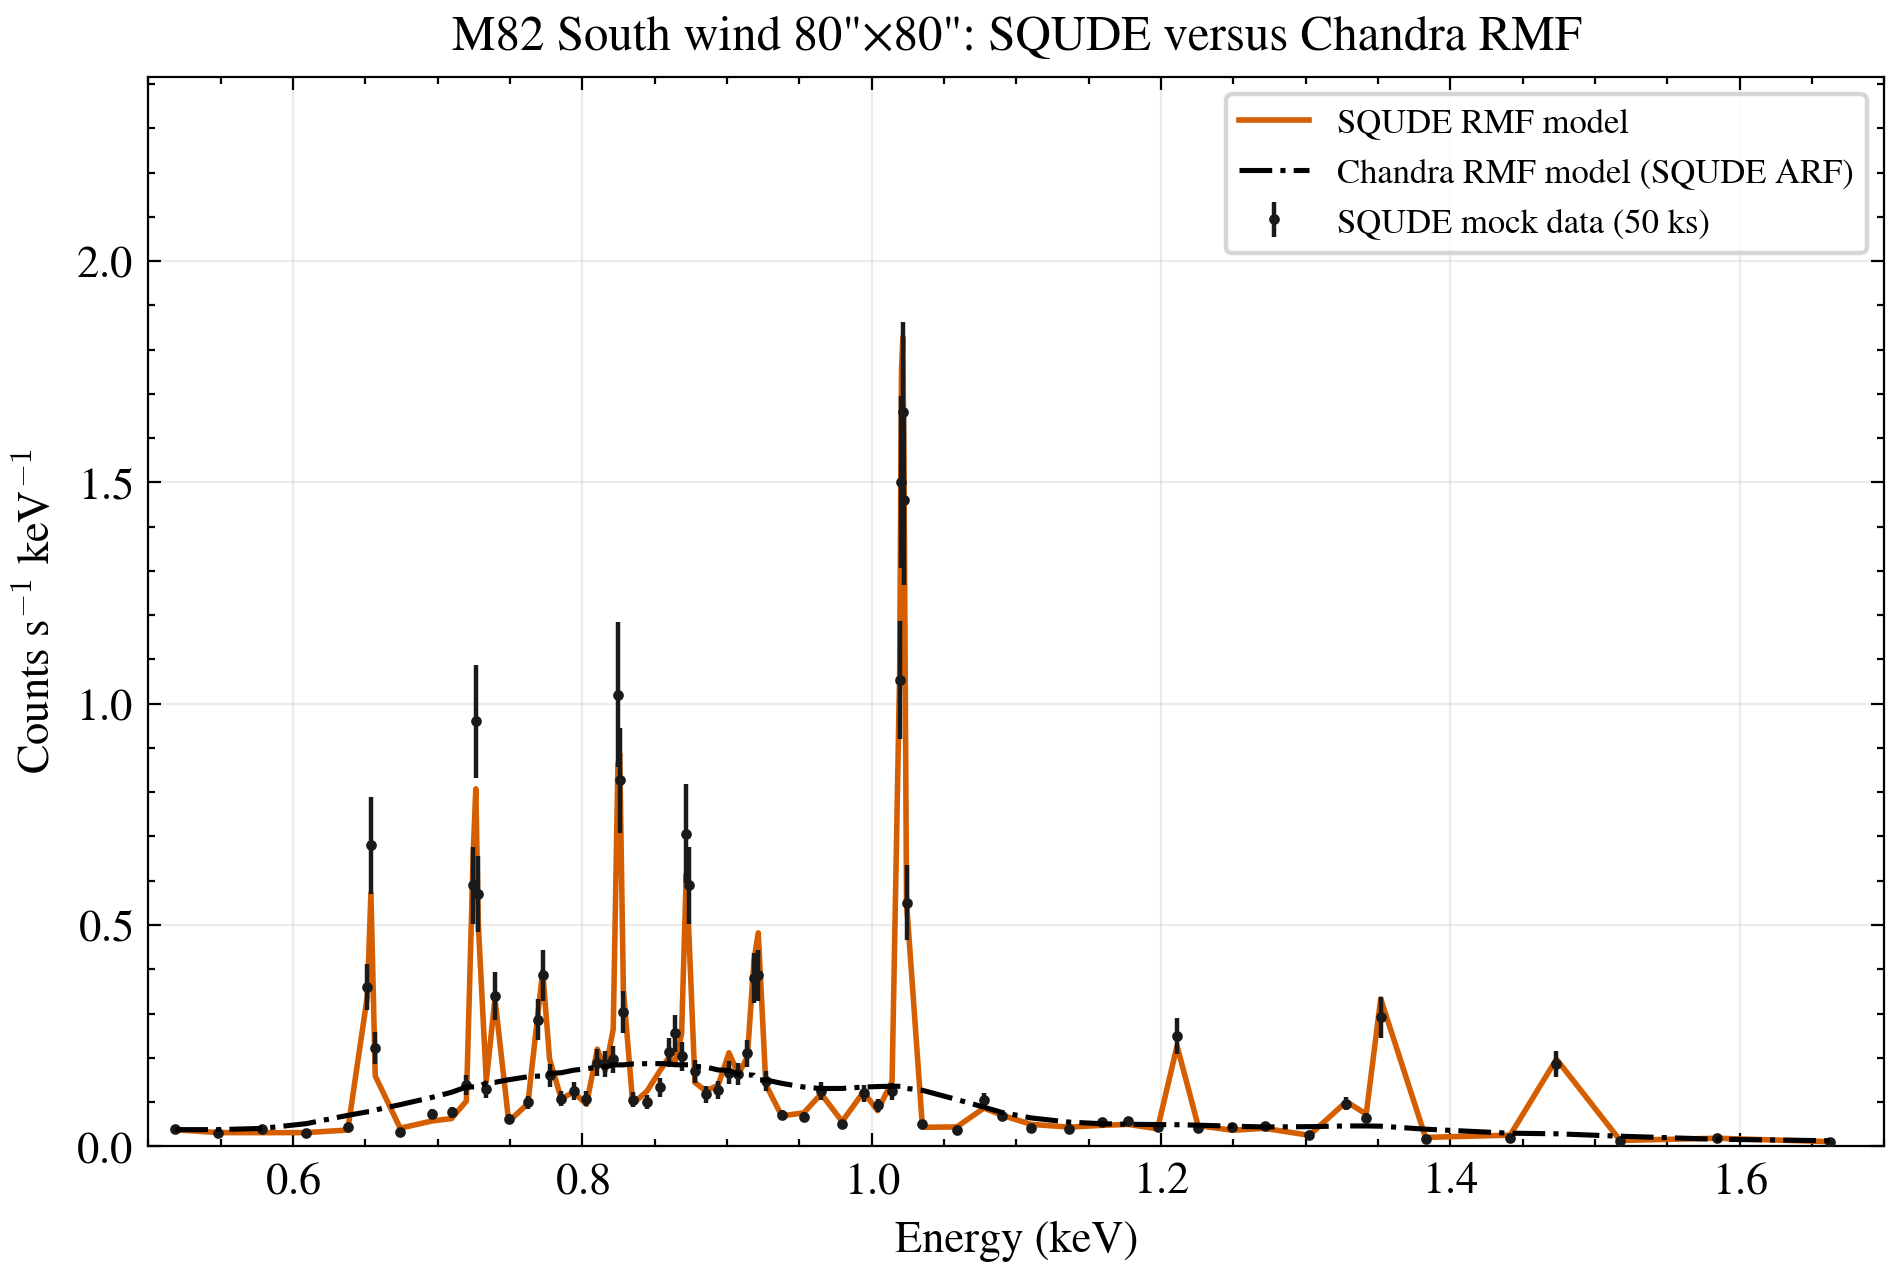 min30 · 30 counts/binmin50 · 50 counts/bin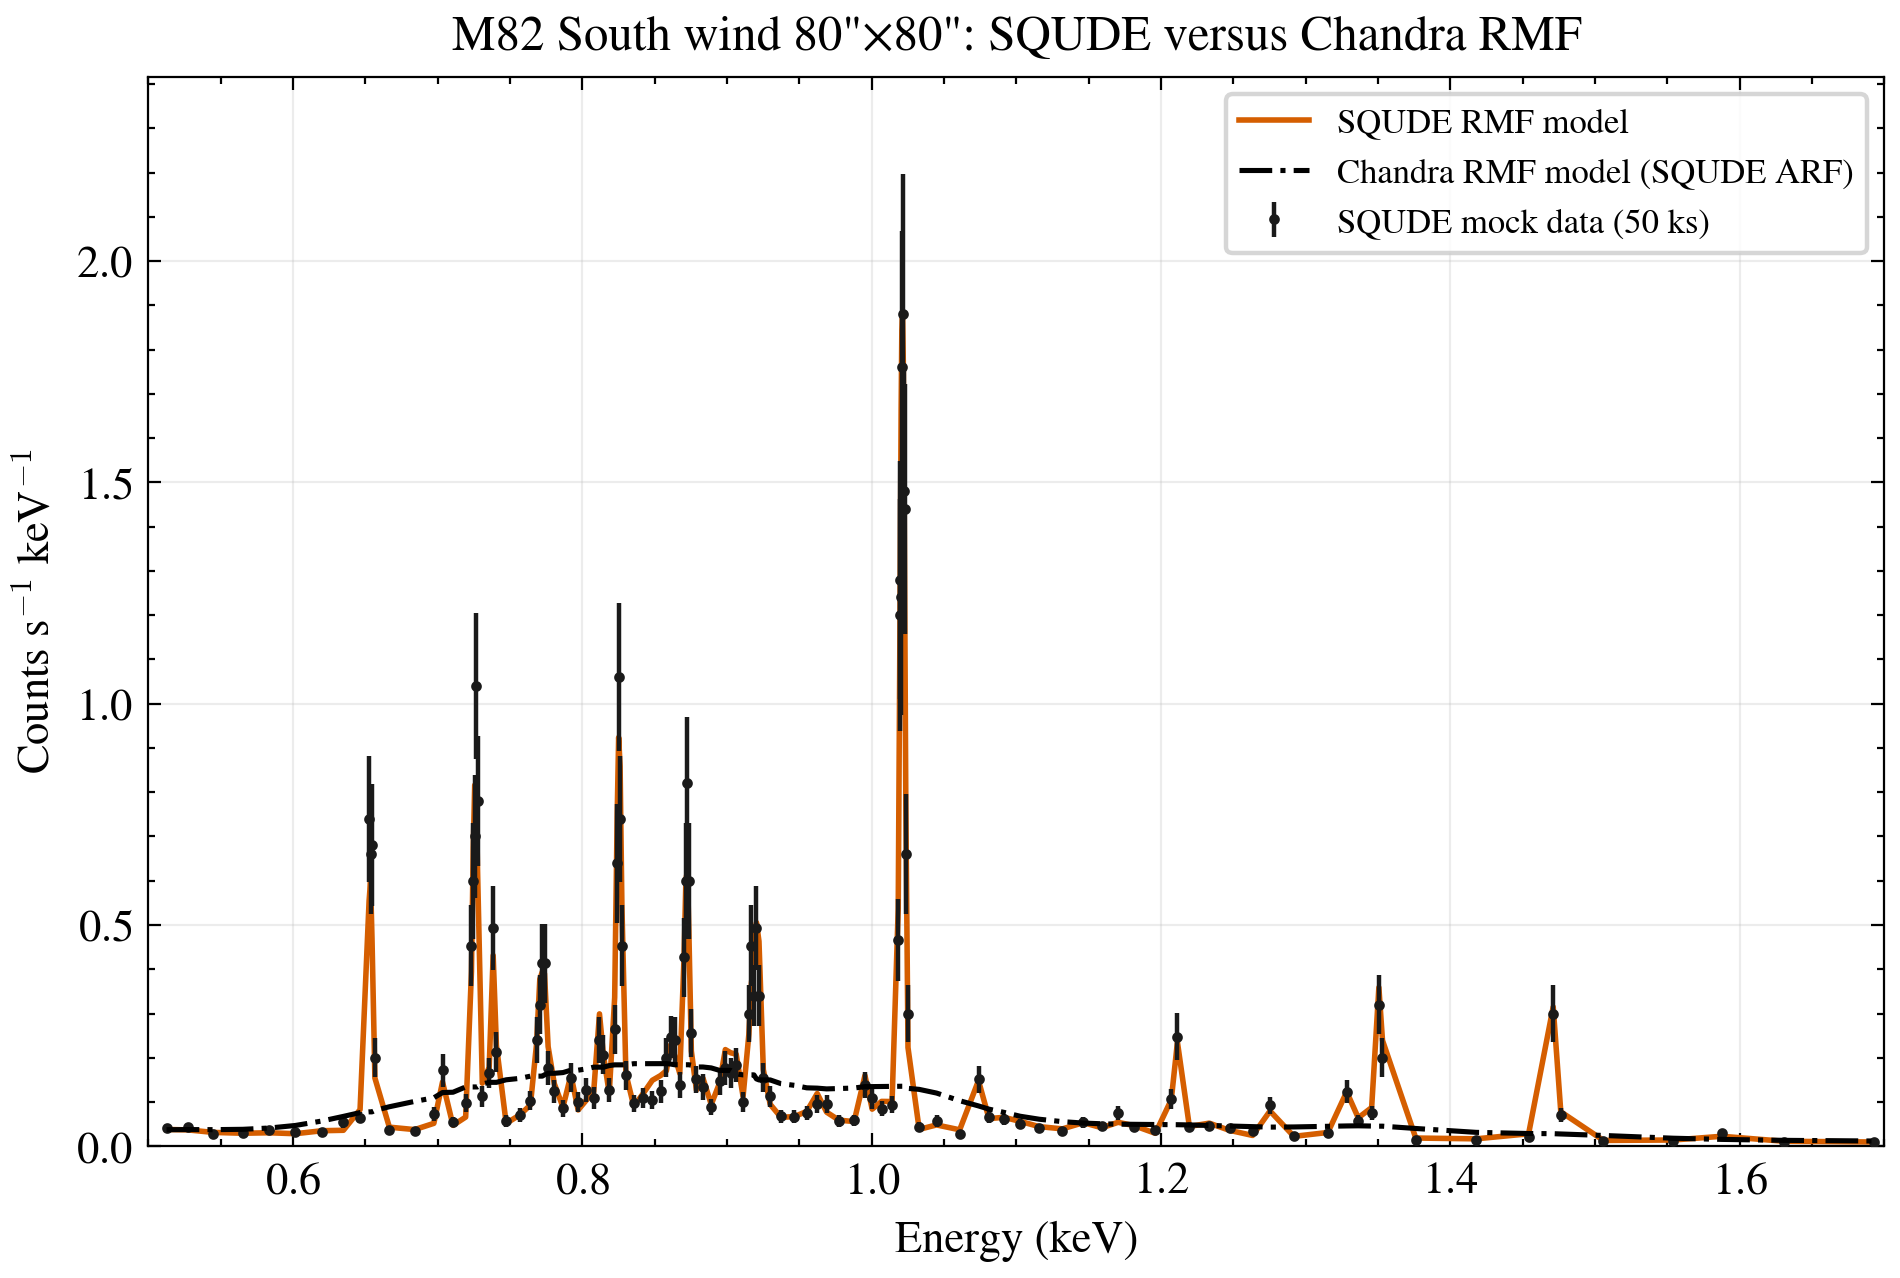
min50 1-columnmin50 2-columnmin30 1-columnmin30 2-column
Download the complete joint-center script · Download its required region helper · Download the joint-center provenance manifest
Numerical validation and reproduction
| Check | Result |
|---|---|
| Explicit Chandra RMF operator vs Sherpa native fold | p95 relative error = 2.45×10⁻¹⁵ |
| Chandra total vs sum of Chandra-response-folded model components | p95 relative error = 2.83×10⁻¹⁵ |
| SQUDE total vs sum of model components | p95 relative error = 5.92×10⁻¹⁶ |
| Three-region Chandra component closure | p95 ≤ 3.42×10⁻¹⁵ in every region |
| Regional/eight-epoch explicit RMF operator vs Sherpa | p95 ≤ 2.79×10⁻¹⁵ |
| Three-region SQUDE component closure | p95 ≤ 6.28×10⁻¹⁶ in every region |
| min50 → min30 displayed bins (0.5–1.7 keV) | Full 662→971; North 61→101; Center 297→464; South 83→139; unchanged raw PHA |
| Three-region Chandra-RMF control rate-conserving rebin | relative rate error ≤ 1.90×10⁻¹⁶ |
cd ~/program/M82
export ASCDS_OVERRIDE=1
source ~/software/ciao-4.18/bin/ciao.sh -q
export PFILES="$PWD/pfiles;$ASCDS_INSTALL/param:"
python scripts/make_m82_mock_tutorial_figure_set.py
python scripts/make_m82_three_region_joint_center_tutorial_figures.py
Download complete executable script · Download full-aperture grouping provenance manifest